Most modern sailing boats have at least a minimal instrumentation set on board displaying information such as speed, water depth, wind speed and direction.
These sensors collect different types of information, for example:
Anemometer – wind speed and direction
GPS – location, magnetic direction, speed of travel over ground
Log – speed of movement through the water
Depth Sounder – water depth either below the sensor or below the water line where the sensor has been calibrated.
The information collected by the sensors is displayed on various instruments around the boat.
Additional value may be added to the information received from the sensors by the display devices. For instance, the Wind Display may show both the apparent wind information coming from the Anemometer and a calculated value for true wind speed and direction.
To enable the display of the data and calculation of additional information, the instruments and sensors need to be linked together. Different manufacturers use different types of network to link their devices together.
To maintain a degree of interoperability between different manufacturers instruments National Marine Electronics Association developed several data standards. Most marine instrument systems produced in the past 10 years conform to either the original NMEA 0183 or the later NMEA 2000 standards. There are also commercial products available that will transform NMEA 0183 data to NMEA 2000 format. The Ashtree Partnership’s data logging technology (Rockit) reads data in NMEA 0183 format. The data collection software runs on a computer connected to an NMEA 0183 output on a boats network.
Rockit collects, aggregates and allows the analysis of key data points transmitted by the instruments attached to the boats network. Aggregating these data points gives a clear picture of the boats performance.

Data is recorded as a session. Rockit allows the comparison of data points between different sessions. So if the configuration of the boat changes you can easily compare before and after performance.
Data is available to plot as a time series. So you can see how the boat and wind speed evolves over time and look for those all important wind shifts

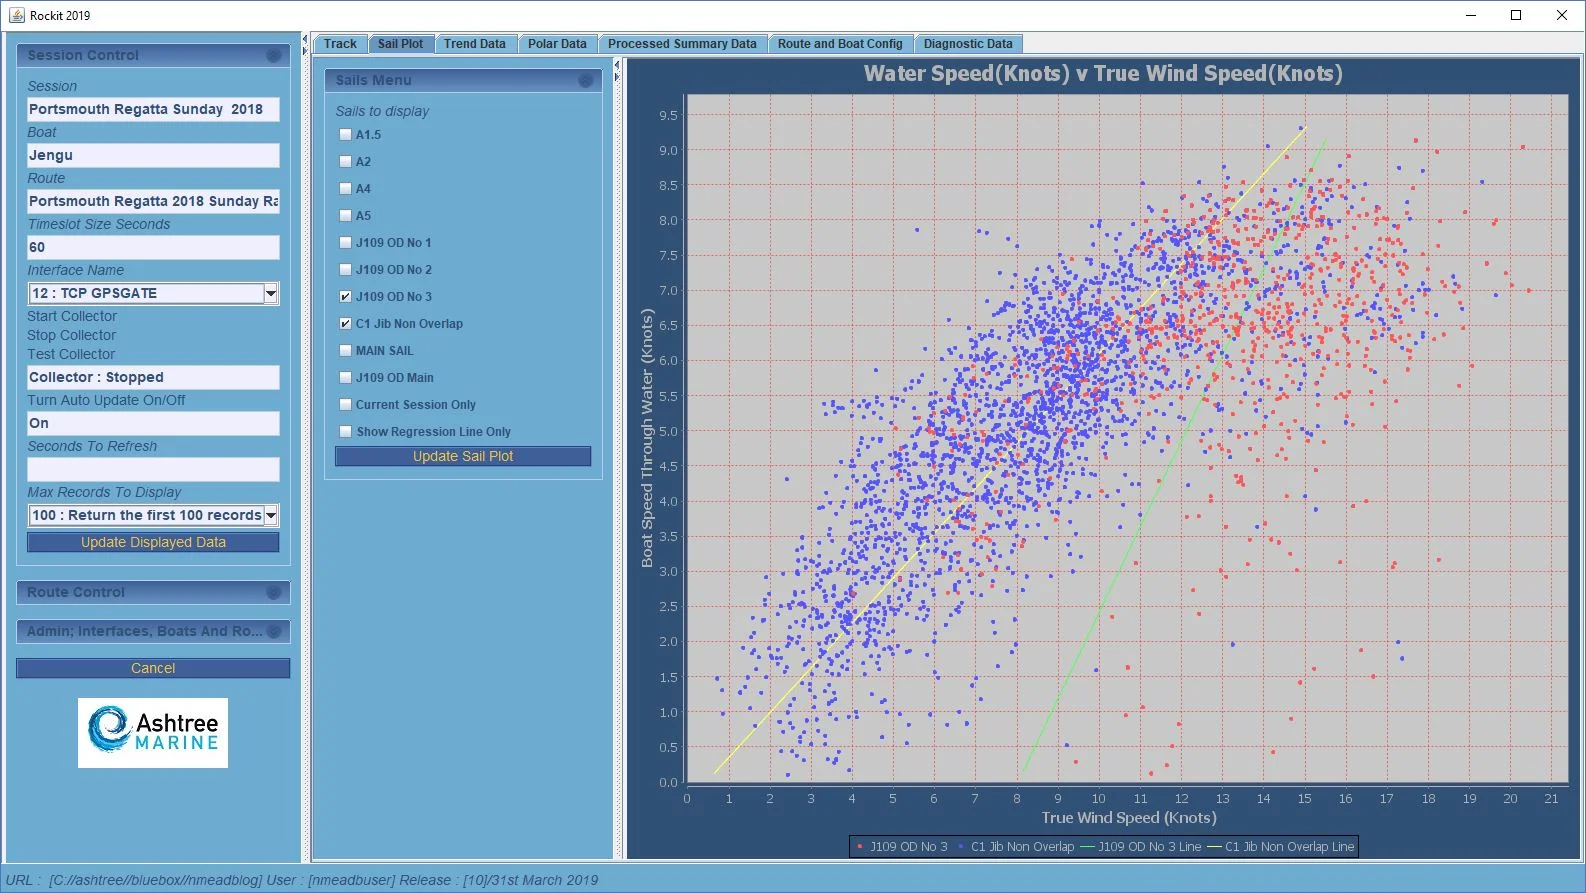
Rockit uses the collected data to produce a picture of the boats performance for each recorded sail. So you can produce cross over charts based on real world data.
Rockit calculates polar data as you sail for each session; that data is then aggregated to the boat level. Rockit will display the information in both tabular and graphical form.

Or in the context of the boats track. The boats performance profile is overlaid on the GPS track. The track is coloured based on the boats performance relative to the recorded boat polars.

Or the polars can be viewed as part of the overall boat configuration:

Boat configuration information is recorded so that you can review the impact of charges you make. You can define your own boat configuration items; anything from the sails in use to what the crew had for lunch.

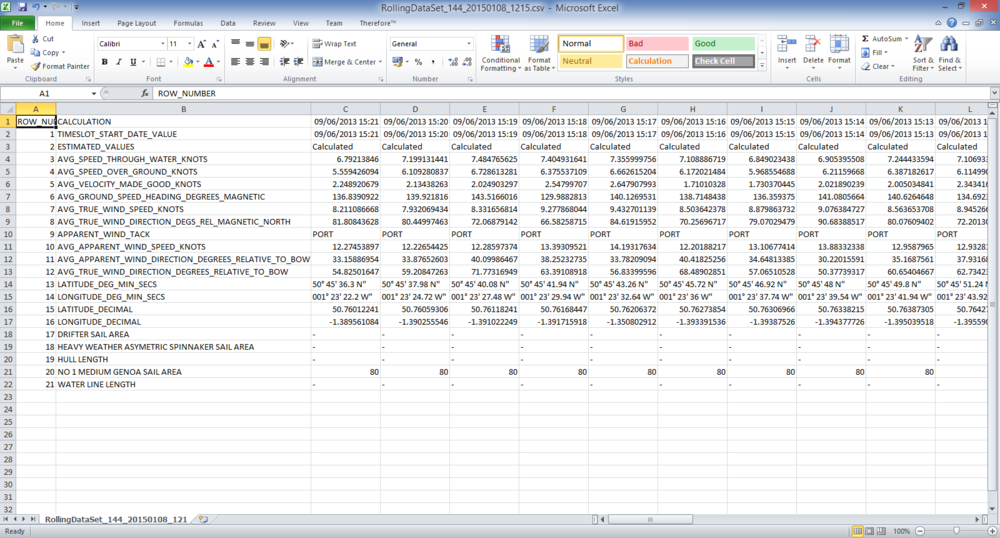
And if you can’t find the answer you are looking for you can export the data to csv for more detailed analysis in tools like Microsoft Excel.
Or as a .KML file for loading into Google Earth.