Overview
Rockit is all about making the most of the data that you collect and turning it into meaningful information that can be learnt from long after its original collection. The software allows you to review most of the data as its collected. That was part of the rationale behind creating Rockit we wanted to be able to react in real time to the trends in the information. We also appreciate that its useful to be able to dig down into the data after the event.
The Rockit 2025 Release gives you three ways of looking at the information.
- On the screen in real time. Either on a Laptop or on a Rockit Server Device.
- On a the Rockit software after the event or.
- On the Rockit Cloud Analytics platform; where you can share summaries of the information collected after the event with your crew….
The software that runs on a Rockit Server Device to collect data is effectively the same software that runs on your laptop to collect data. The screens reconfigure themselves to the smaller 7inch touch screen on the Rockit Server device.
So for Rockit 2025 onwards you will be able to collect data on both the Laptop and Rockit Server Device version of the software. You will then be able to upload data from there to the Rockit Cloud Analytics platform. More of that in a later article.
The Session List Screen
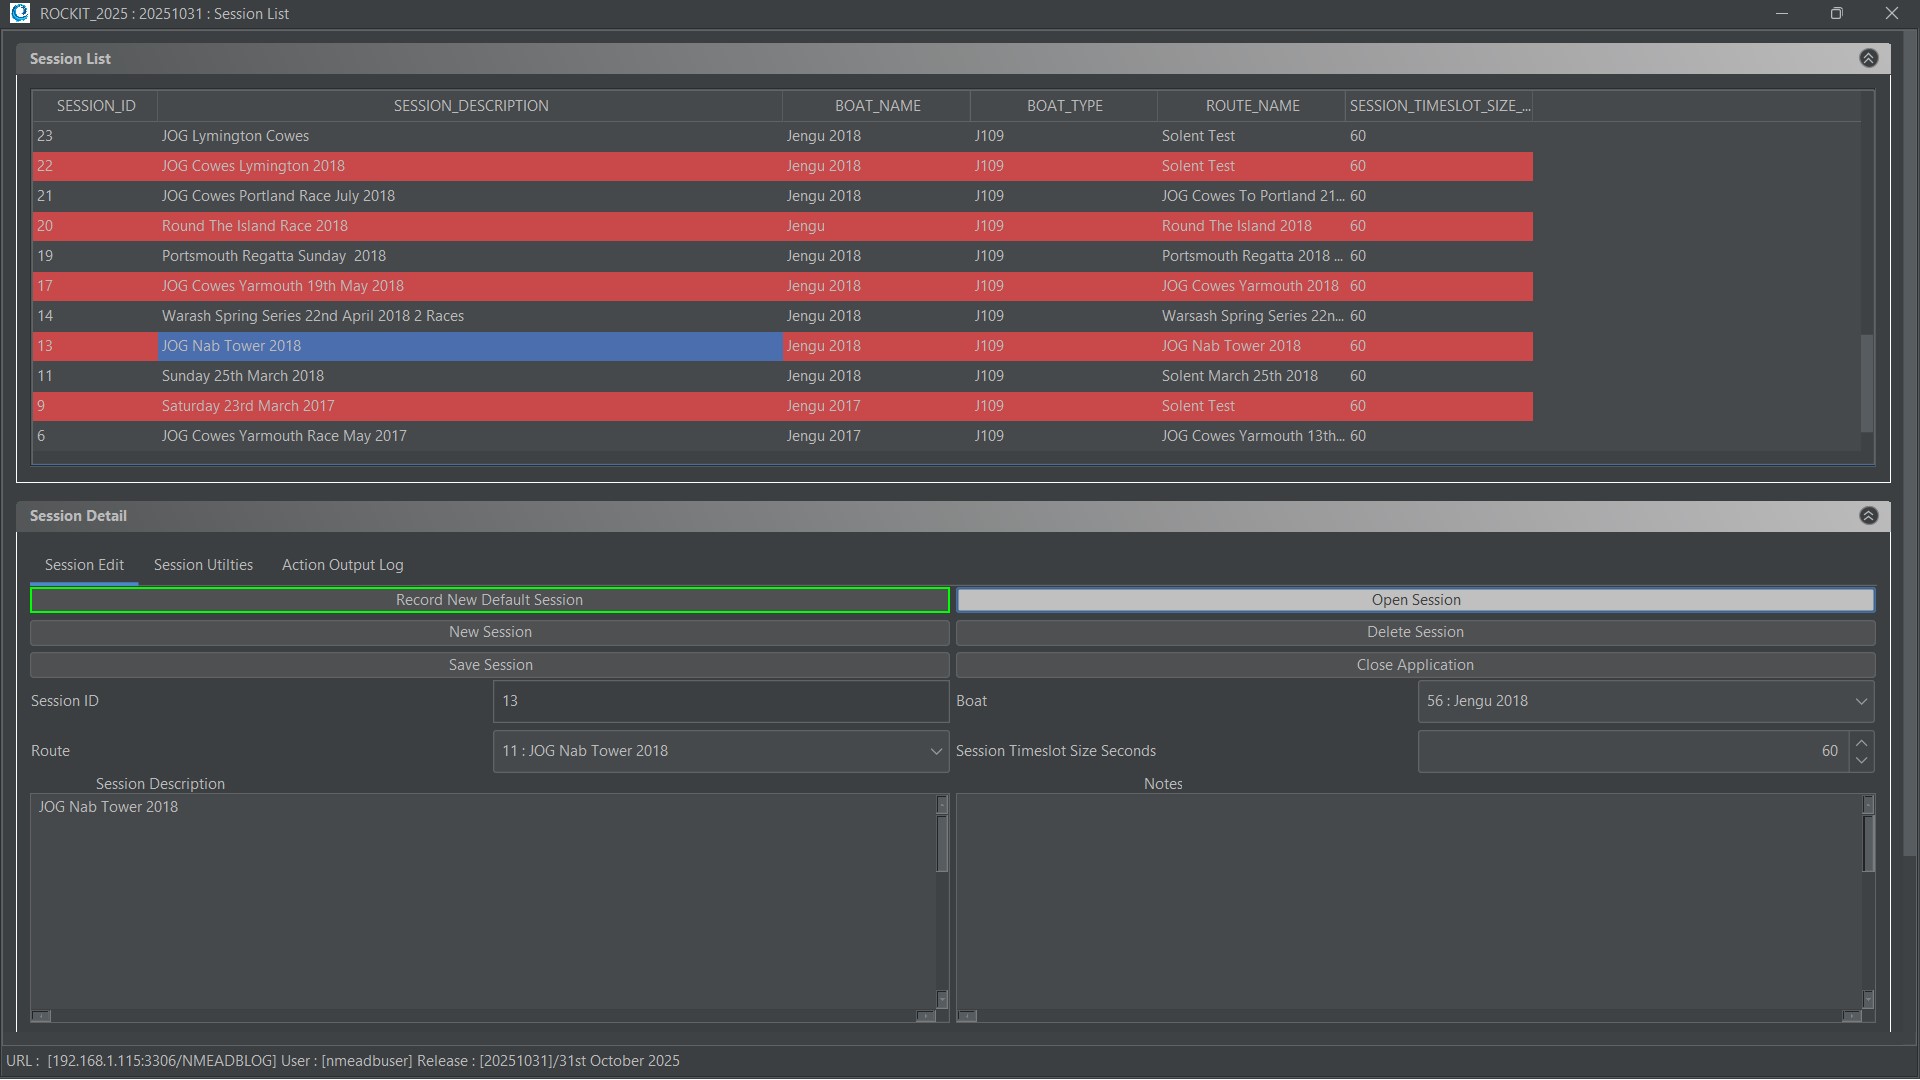
This is the screen that you get when you open Rockit on a Laptop or Rockit Server Device. It gives you a list of the sessions that you have already recorded and the ability to edit the descriptive information about those recording sessions. Clicking a row in the list of recorded sessions brings the data values into the form in the bottom half of the screen.
You can also use the “Record New Default Session” to start a brand new recording session using the system defaults. You can start recording with one click and walk away from the device.
Session Edit Panel
Whats on this panel ?
| Field | Description | Source/Format | Editable ? |
|---|---|---|---|
| Session Description | Session Description | Free text | Yes |
| Session Notes | Notes about the session | Free text | Yes |
| Boat | Boats sourced from the Boats entered the Boats Screen | Drop List | Yes |
| Route | Either the Route you select sourced from the Routes entered on the Routes screen or the Route that Rockit generates while recording from Chartplotter Waypoints if the New Default Session is created. | Drop List | Yes |
| Timeslot Size Seconds | Size of the timeslots currently set for this Session | Either the Rockit system default value or the value you set | Yes |
| Record New Default Session | Button to start data default collection process | Button | N/A |
| Open Session | Button to open a recorded session and view the data | Button | N/A |
| Stop Collector | Button to stop collection process | Button | N/A |
| New Session | Button to create a new blank session that you can configure | Button | N/A |
| Delete Session | Button to delete an existing session and all its data | Button | N/A |
| Close Application | Button to close the Rockit Application | Button | N/A |
Session Utilities Panel
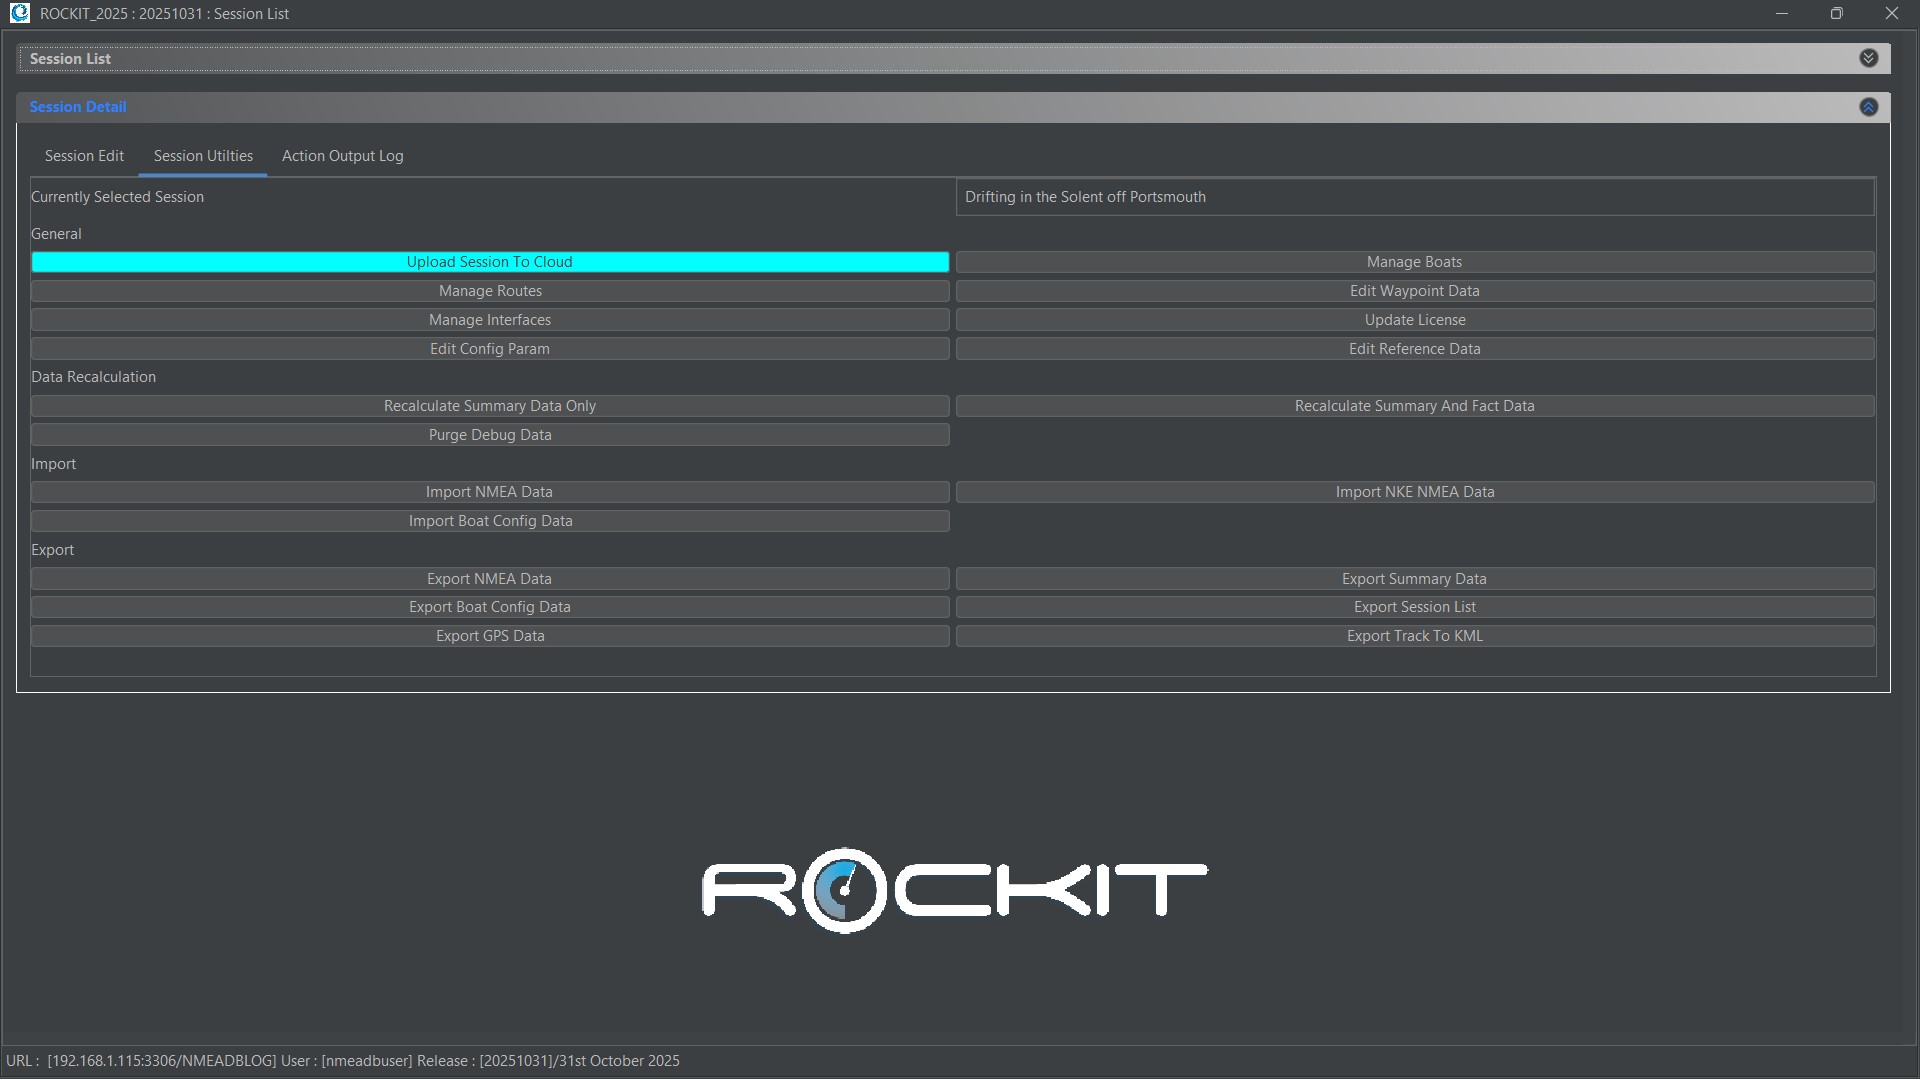
This panel acts as a control centre for the Rockit software.
It provides the following functions;
| Button | Description |
|---|---|
| Upload Session To Cloud | Uploads the session summary and polar data to the Rockit Cloud Analytics platform. We will talk about the Cloud Platform in a future article. |
| Manage Boats | Opens the screen to manage your boat configurations, review polars and sail plots at boat level. |
| Manage Routes | Opens the screen to manage your routes and waypoints. |
| Manage Waypoints Data | Opens the screen to manage your base Waypoint data. So if you want to upload all the Solent racing marks this is the place to do it. |
| Manage Interfaces | This opens the screen that allows you to setup the source of your NMEA data. Whether its an Actisense W2K-1 Wi-Fi transmitter or a Yacht Devices USB connector configure the device here. |
| Update License | Rockit software is on an annual license. You can use this screen to enter your latest license info including the license key you will receive from Ashtree Marine. |
| Edit Config Param | Many of the Rockit configuration parameters are configurable by the user. For instance you can change the threshold beyond which Rockit treats NMEA sentences as outliers and rejects them. This is definitely an advanced option ! |
| Edit Reference Data | You can update the values that appear in the various drop lists within Rockit. For instance you can edit the list NMEA Sentences used in calculations. Again this is an advanced function ! |
| Recalculate Summary Data | Rockit collects and stores NMEA raw data. It then creates from that a set of facts. From those facts it produces summary data. This function will recreate the summary data from the Facts. That process is less comprehensive than recreating all the summary and fact data from the raw NMEA data but a lot quicker |
| Recalculate Summary and Fact Data | Similar to the Recalculate Summary Data. This will delete all the Summary and Fact data and run all the calculations again from the Raw NMEA data. So if you have edited your Raw NMEA Data for a Session you will need to use this button to push the changes through to the Summary reports. |
| Purge Debug Data | Rockit data collection processes generate a lot of logging information. This button allows you to purge that log data and shrink the size of the database. |
| Import NMEA Data | Import NMEA Data from another source. This will import data into a session. This uses a csv file format to load source NMEA data. Once the data is loaded into the Raw table you will need to run the recalculation process to generate the fact and summary information. You can use the export NMEA data button to generate a template file for import. |
| Import NKE NMEA Data | Import NMEA Data from an NKE Data source. Similar to the standard NMEA import but designed to import NMEA 0183 data from an NKE source. |
| Import Boat Config Data | Import Boat Configuration Data. This will import the configuration data into a session. This uses a csv file format to load source NMEA data. You can use the export Boat Config Data button to generate a template file for import. |
| Export NMEA Data | Exports the NMEA data for a session to a csv file. |
| Export Summary Data | Exports the fact and summary data for a session to a csv file. |
| Export Boat Config Data | Exports the boat configuration data for a session to a csv file. |
| Export Session List | Exports the list of recording sessions. |
| Export GPS Data | Exports GPS Fact data to a csv file. |
| Export Track To KML | Exports the Track and Summary Data to a KML file so that it can be loaded into Google Earth. |
The Recording Session Screen
Clicking the Open Session button on the Session List opens the selected session in Recording Session Screen.
This displays all the data, Raw and Summarised collected during the recording session. This form will also open when you start recording a Session using the Record New Default Session on the Session List. As the recording takes place this screen will automatically update at the end of each Time Slot. A timeslot is a sample period. Each session is broken into timeslots and the data collected during the timeslot is aggregated to display on the screen. So you use this screen to both see data as its recorded in real time and review it after the event.
So what is displayed ?
The Rockit Session Display screen has 12 Tabs. The data displayed on the Rockit Server screen is the same as the information display on the Laptop/Desktop version of the software.
The table below details the different sets of information. With a few exceptions most of the tabs contain one or more Panels. The data displayed on those Panel is described in the following section.
| Tab | Description |
|---|---|
| Session | Shows session definition and allows starting, stopping, and testing of recording. |
| Track | This plots the boat’s track on a basic map display. The track is annotated and coloured based on the boat’s performance during the previous sample period. |
| Live Data | Displays current or point-in-time data using graphs and numbers from the Track. |
| Sail Plot | This will plot sail usage against boat and wind speed. |
| Trend Data | This allows the summary data to be plotted in time series form. You can see how the wind/boat performance indicators evolve over the session. |
| Polar Data | This plots boat performance against true wind speed in both tabular and graphical form. |
| Summary Data | This is a rolling view of the summary data, showing boat performance per period. It relates boat config info (e.g. helm name) to performance (e.g. speed). Aggregated by timeslot size. |
| Peak | This will display the configuration for the boat when it performs best for a given boat and wind speed. This searches the data recorded for the boat to find the best combination. |
| Route and Boat Config | Displays and allows editing of the boat’s active configuration (e.g. sails) and route (e.g. waypoints). Useful for mid-session updates. |
| Time Config | Displays and allows editing of the boat’s active configuration (e.g. sails) and route (e.g. waypoints). Useful for mid-session updates. It makes it possible to record the configuration recorded for each timeslot after the event. You can for instance update the sails in use as the trip/race progresses after the event. |
| Diagnostic Data | Includes several diagnostic tools:
|
| Log | Displays Track, Live Data, and Configuration Comparison all in one tab. |
Tab One : Session
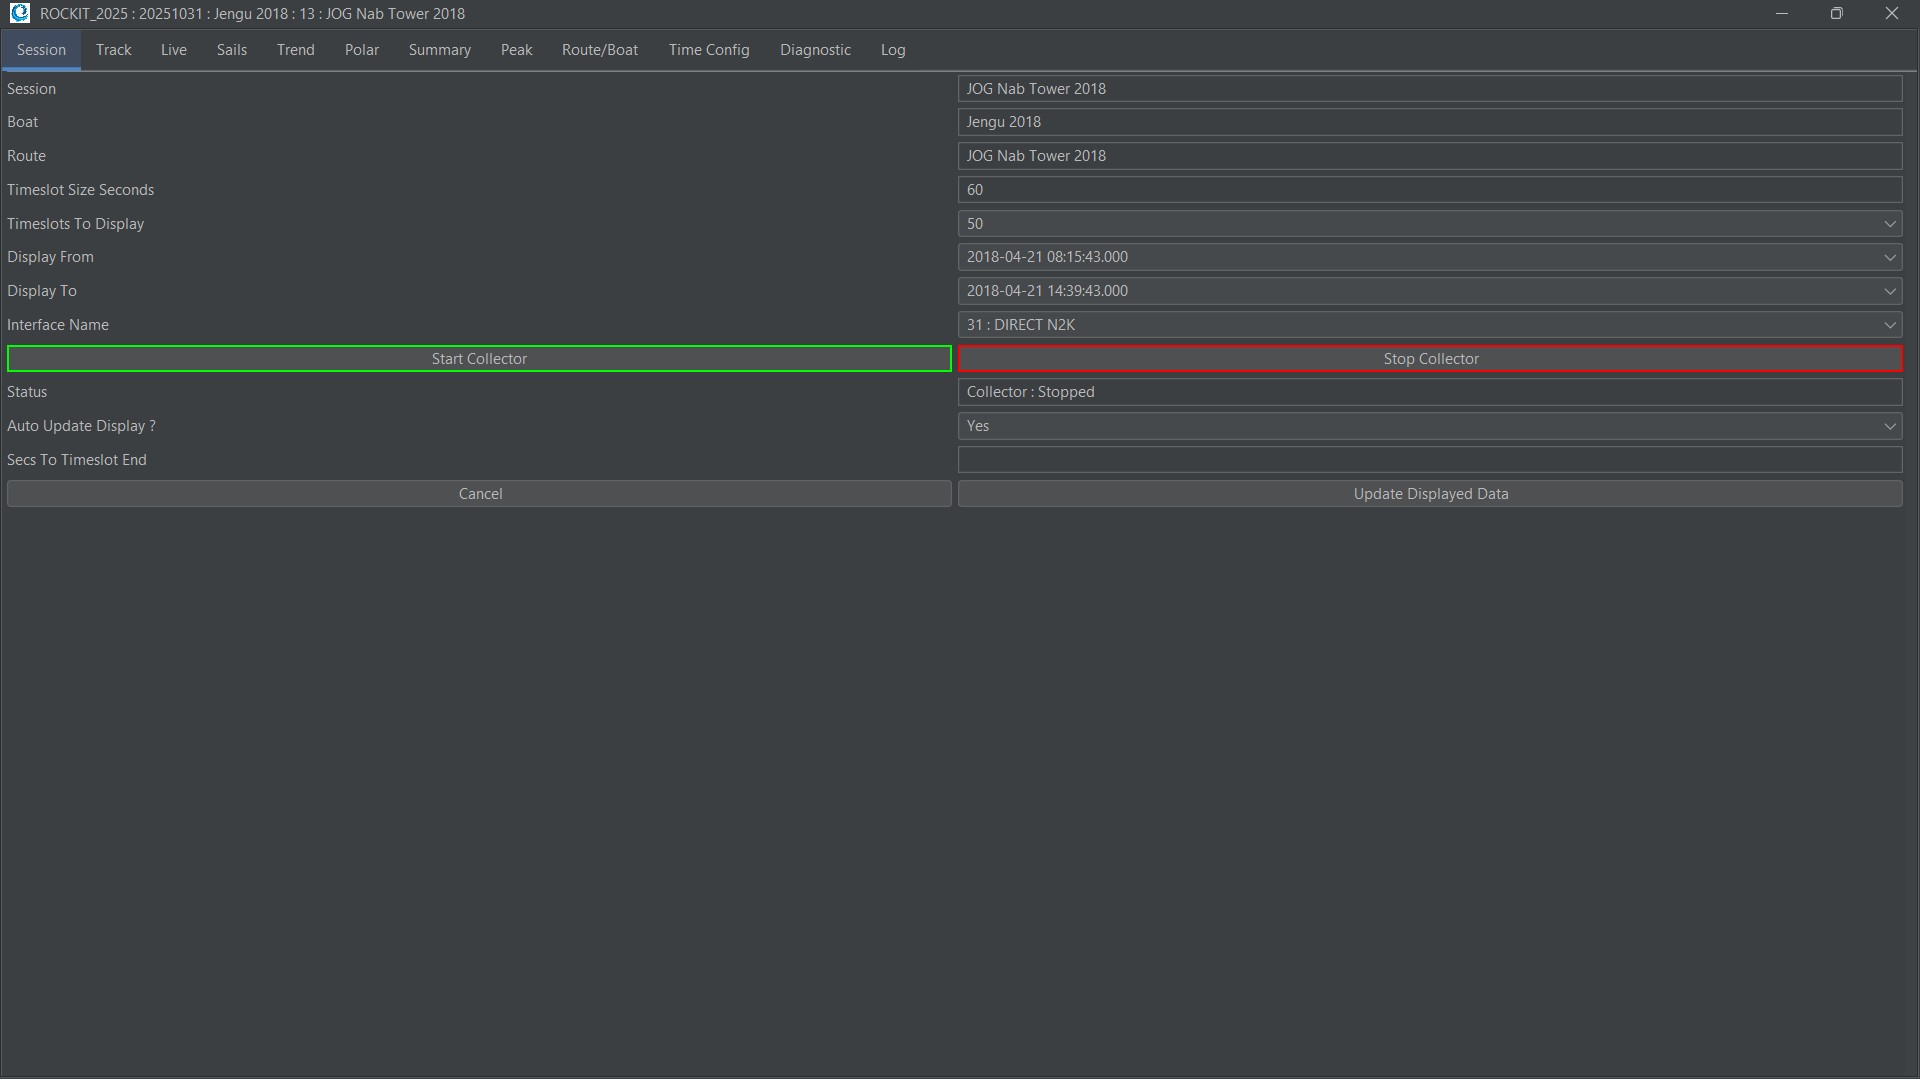
Whats displayed on this panel ?
| Field | Description | Source/Format | Editable ? |
|---|---|---|---|
| Session Description | Session Description | Text Field | No |
| Boat Name | Boats sourced from the Boats entered the Boats Screen | Text Field | No |
| Route Name | Either the Route you select sourced from the Routes entered on the Routes screen or the Route that Rockit generates while recording from Chartplotter Waypoints if the New Default Session is created. | Text Field | No |
| Timeslot Size Seconds | Size of the timeslots currently set for this Session; Either the Rockit system default value or the value you set | Text Field | No |
| No Of Timeslot To Display | Sets the number of timeslots/sample periods that will be displayed on this page during the recording process. A cros s channel trip with a timeslot size 30 seconds will generate a lot of data so it makes Rockit more responsive if for instance only the last 50 timeslots are displayed | Drop List | Yes |
| Display From | Display timeslots starting from; Use this when reviewing recorded data to narrow down the data you want to see | Drop List | Yes |
| Display To | End of the time range you are interested in. | Drop List | Yes |
| Status | Is the data collector running ? | Text Field | No |
| Start Collector | Button to start the collection process. You don’t have to start the data collection process from the Session List. You can create a new session on the session list, open it then start recording when you are ready. You can also use a combination of the start and stop buttons to pause a recording session | Button | N/A |
| Stop Collector | Button to stop collection process | Button | N/A |
| Auto Update Display | When recording the screen will update automatically at the end of each timeslot; for instance every 30seconds. This allows you to turn off that automatic update of the screen; recording will continue in the background. You can use the update displayed data button to manually update the data on the screen. | Drop List | Yes |
| Seconds to the end of the Timeslot | The number of seconds until the screen will update when in automatic update mode. This will count down to 0 for each timeslot | Text Field | No |
| Cancel | Button to close the Recording Session Data Screen | Button | N/A |
| Update Displayed Data | Button to manually update the displayed data. | Button | N/A |
Tab Two : Track
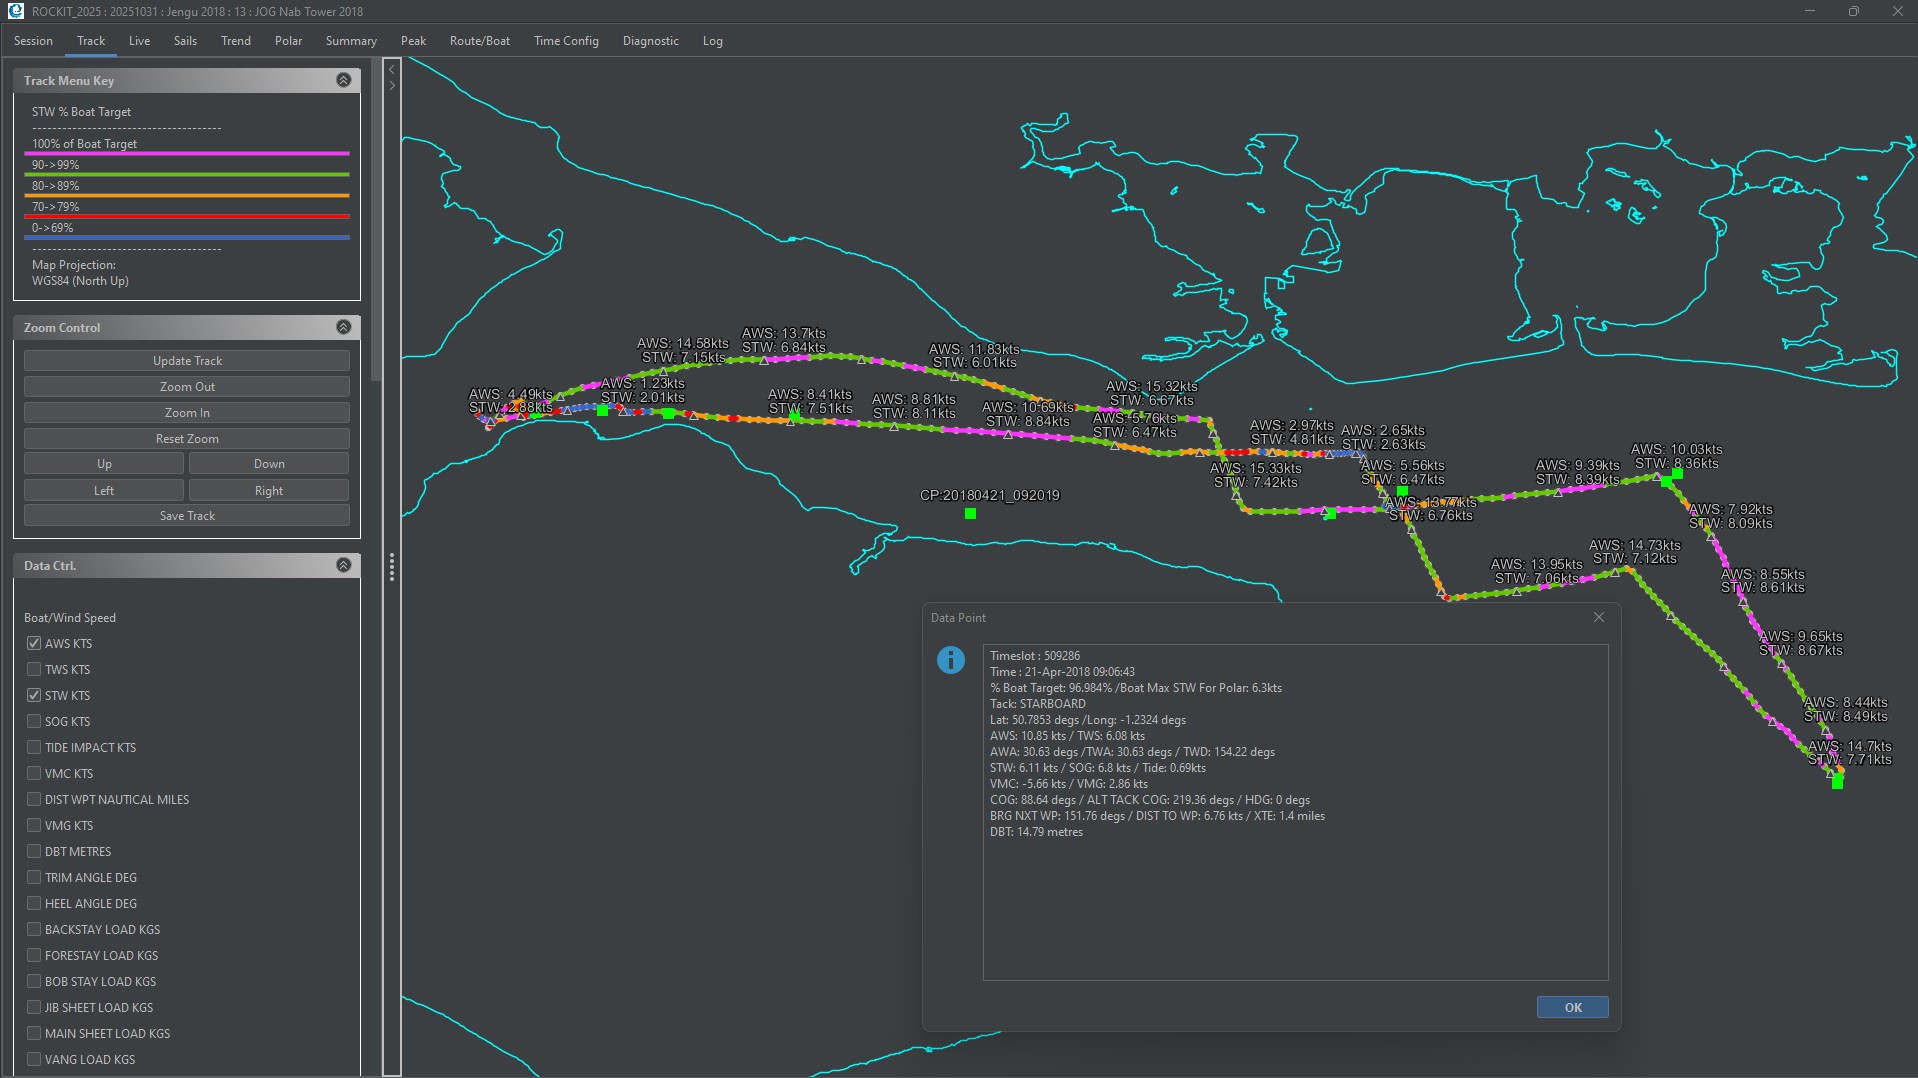
The track panel displays a simple coastline map with the track of the boat superimposed on it.
The track is made up of a series of dots or circles each representing the end point for a Sample Period/Timeslot. The segments linking dots are coloured based on the boats through the water speed relative to the polars for the boat. The colour takes into account the true wind angle, the true wind speed and water speed to colour the track. Purple is the best; generally the max value for the boat or equal to the max value for the boat.
The Track menu on the left-hand side of the panel can be used to turn data options on and off. In the image above the Waypoint within the route are being displayed, Clicking a point will bring up a summary of the data for a given point.
Waypoints have a green square symbol. The apparent wind speed and water speed are also being displayed. Labels are displayed every so many dots to avoid cluttering the screen. Waypoints may also not display if they with be overlaid by other labels. You can adjust the frequency of the labels using the Data Label Frequency number field. 1 implies the data labels will appear next to all dots; 5 implies they will appear every 5 dots. When you have checked/unchecked the checkboxes on the menu you need to press the Update Track button to make the screen reload with the changes.
The Pan Up/Down/Left/Right buttons allow you to move around the map. Zoom in/Zoom Out is the Zoom control. Reset Zoom will reset the Zoom to the original proportions.
Tab Three: Live
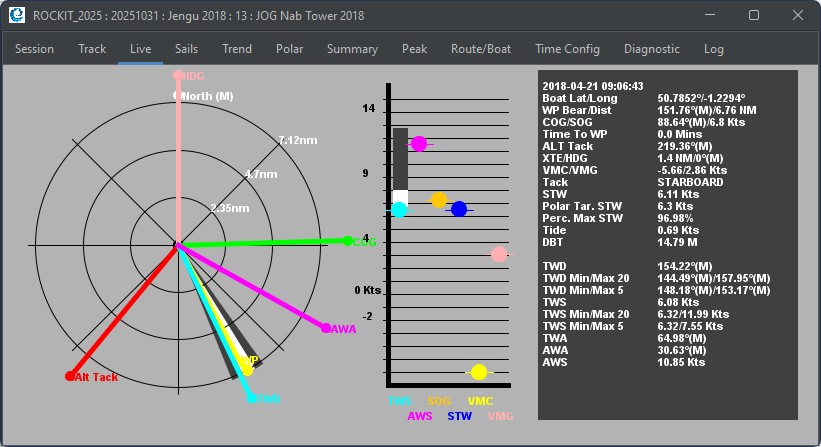
The Live data panel provides a visual representation of the data that is either currently being recorded, where the Rockit Server is recording or the data for a specific point on the Track Panel.
This was originally designed for the Rockit Server version of the product but has been brought back into the Windows Desktop/Laptop version. Its a very effective way of seeing the data that is flowing on you NMEA 2000 bus as this will update in real time rather than at the end of each Timeslot/Sample Period.
Tab Four : Sails
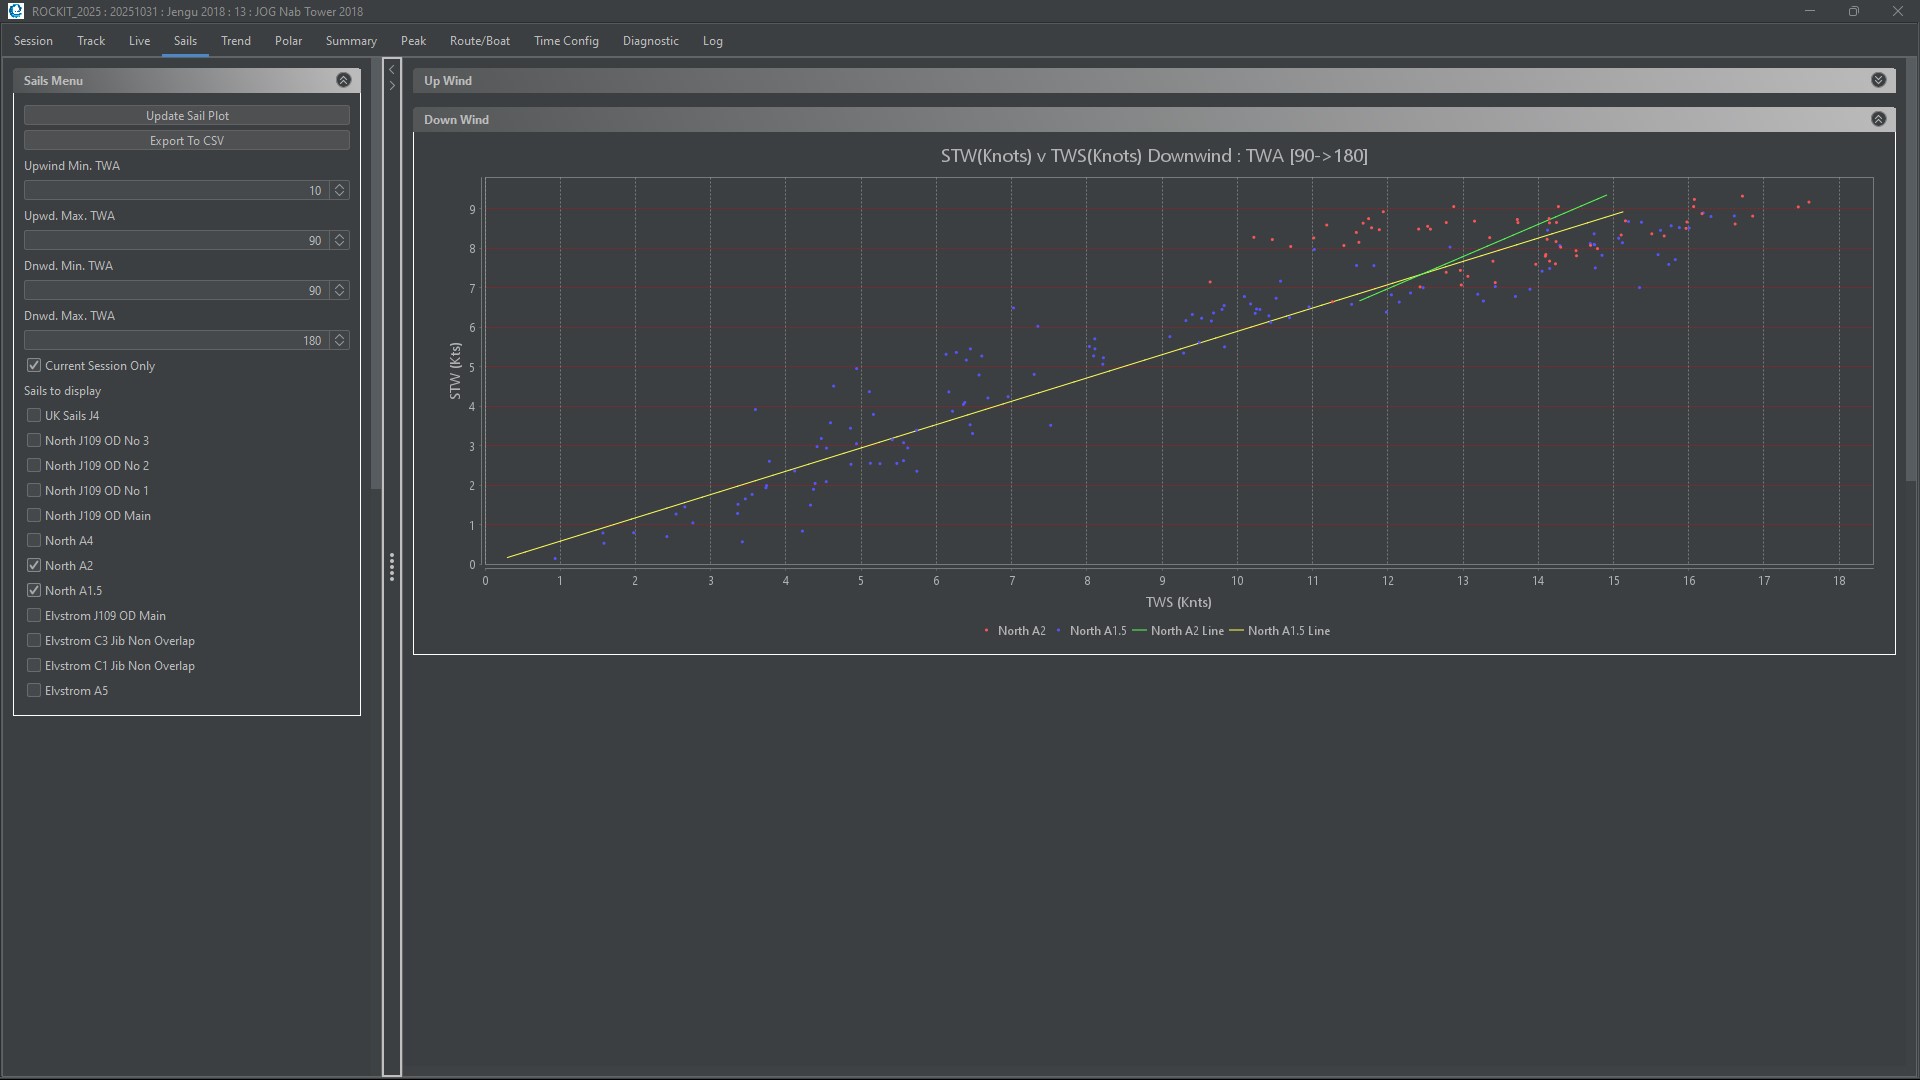
The sail plot panel will pull the data from Sample Periods/Timeslot for a given sail then plot the boat speed against a wind speed. The result is a scatter graph with regression lines showing the performance envelope for one or more sails.
So; in the above screen shot we are plotting the boat speed against true wind speed for two sails, A1.5 and A2. We add a linear regression line to the plot for each sail to show the point at which the sails profiles cross. So, based on the data displayed it makes sense to fly the A2 in anything above 5 knots of wind -> the Yellow A2 regression line is higher than the Green A1.5 regression line.
Toggling the check boxes on the Sail Menu allows you to amend the information displayed. You can display the information at both Boat and Recording Session level. The more data you have the more reliable the data plot is likely to be.
There are two graph panels Upwind and Downwind. You can use the TWA Controls on the control menu to narrow the wind angle that you are interested in. Clicking the arrows in the top right corner of the graph panels minimises or maximises the panel. The divider between the menu and the graph panels can be dragged left/right to resize the two half of the screen.
Tab Five : Trend
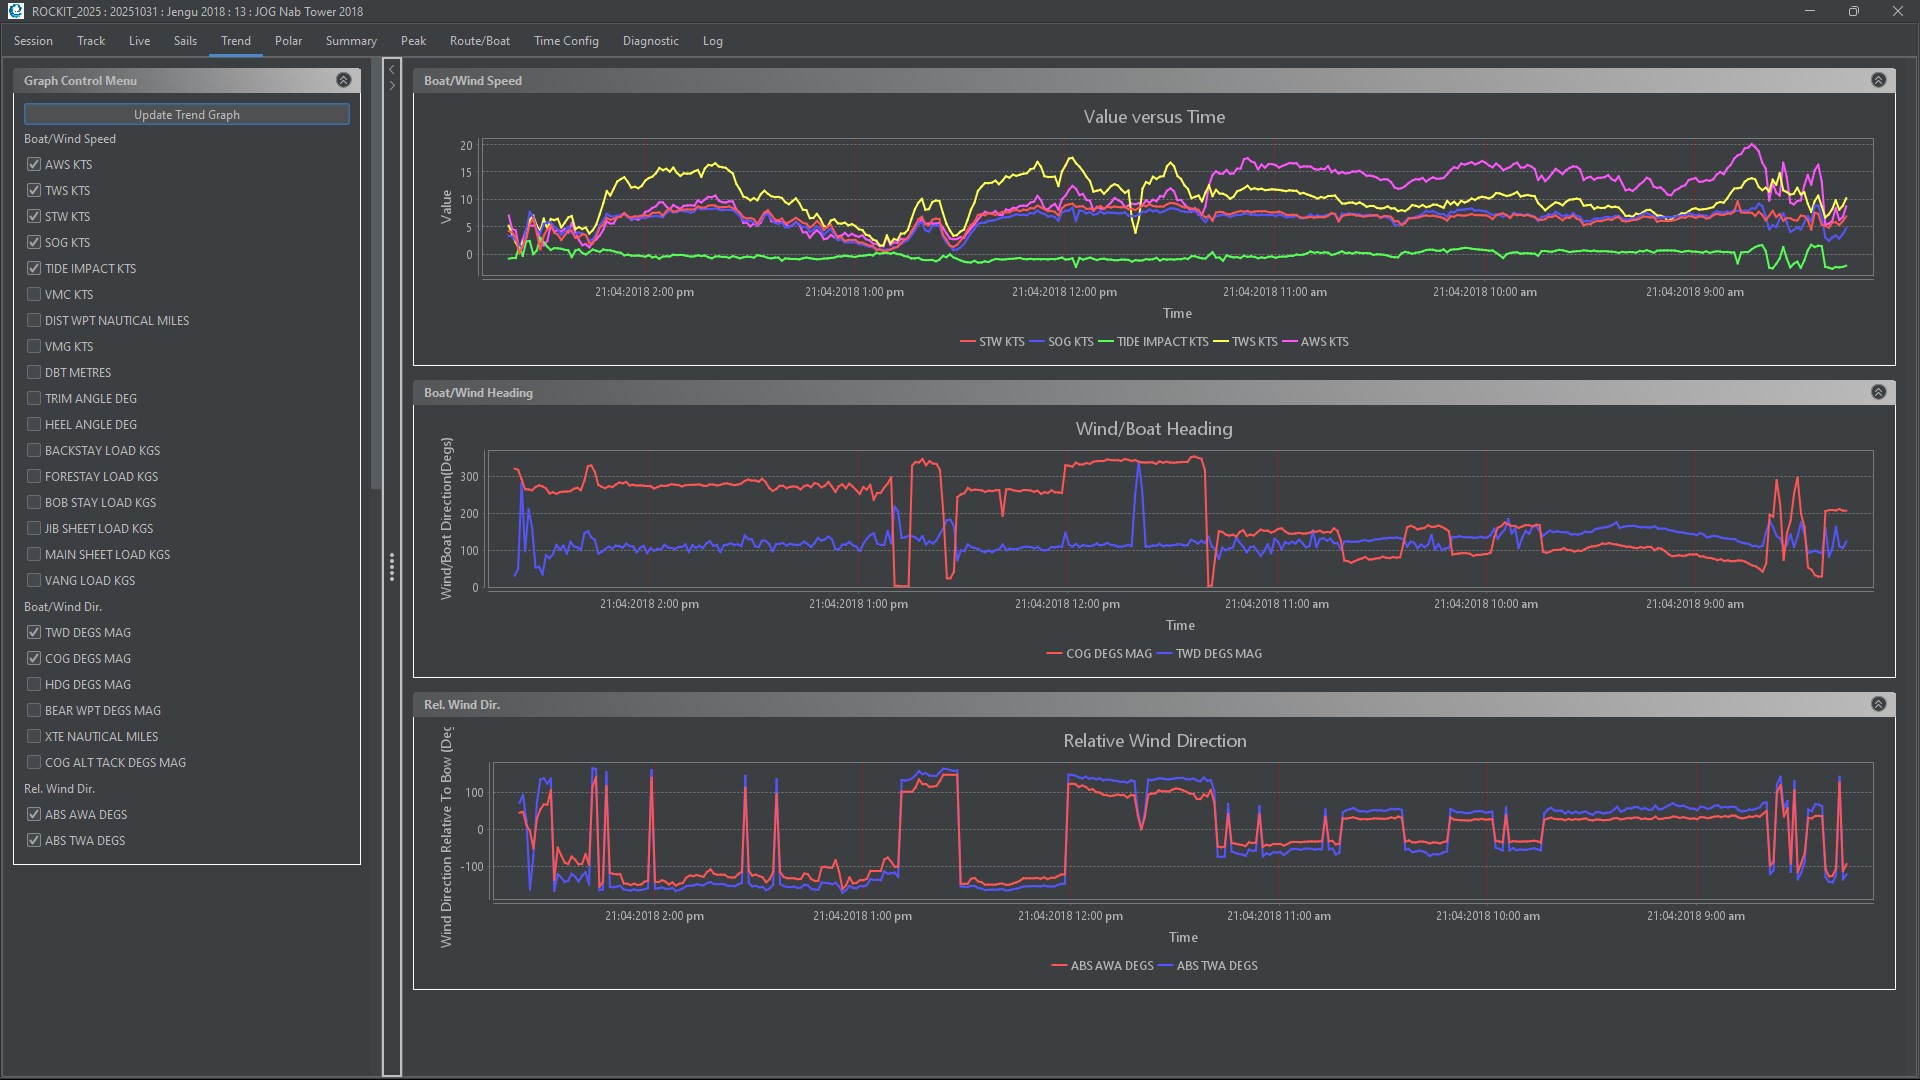
The Trend Data Panel is there to do exactly that, show what the current trends are. The Tab is split into two halves; The left section controls the variables displayed on the graphs. The right section displays the three time series graphs.
Select the variables you want to display and click “Update Trend Graph” to pull the data onto the graphs. You can Zoom in and Out on the graphs and save the graph as an image file that you can share.
The table below lists the variables displayed.
| Variable | Applies to Graph | Description | Abbreviation |
|---|---|---|---|
| Apparent Wind Speed Knots | Value Versus Time | Average apparent wind speed in Knots for a given Sample Period. This is the effective wind speed across the deck. | AWS |
| True Wind Speed Knots | Value Versus Time | Average true wind speed in Knots for a given Sample Period. Based on SOG, AWD, and AWS. Port tack negative, starboard positive. | TWS |
| Speed Through Water Knots | Value Versus Time | Average speed through water in Knots. Derived from the boat’s log sensor. | STW |
| Speed Over Ground Knots | Value Versus Time | Average speed over the ground in Knots, based on GPS data. | SOG |
| Velocity Made Good Knots | Value Versus Time | Average VMG towards the currently defined waypoint, not necessarily windward/leeward VMG. | VMG |
| True Wind Direction Degrees Relative to True North | Wind Boat Heading | Average TWD relative to true north. Minimises short-term shifts via averaging. | TWD |
| Course Over Ground Degrees Magnetic | Wind Boat Heading | Average COG in magnetic degrees. GPS-derived and useful with heading to determine leeway and tide. | COG |
| Boat Heading Degrees Magnetic | Wind Boat Heading | Average heading in magnetic degrees. Requires fluxgate compass. | HDG |
| Bearing to Next Waypoint Degrees Magnetic | Wind Boat Heading | Average bearing to next waypoint. Use with HDG and COG to find optimal course. | DIST WPT NAUTICAL MILES |
| Apparent Wind Direction Degrees Relative to Bow | Value Versus Time | Average AWD relative to bow. Based on wind felt over deck (or top of mast, if uncalibrated). | AWA |
| True Wind Direction Degrees Relative to Bow | Value Versus Time | Average TWA relative to bow. Calculated from SOG, AWA, and AWS. Port tack negative, starboard positive. | TWA |
| Depth Below Transducer | Value Versus Time | Depth below transducer in metres. | DBT |
| Heel Angle Degrees | Value Versus Time | Heel angle in degrees. Starboard heel positive, port heel negative. (NMEA 2000 data source only) | HEEL |
| Trim Angle Degrees | Value Versus Time | Fore/aft trim angle. (NMEA 2000 data source only) | TRIM |
| Bobstay Load | Value Versus Time | Load on bobstay in kilograms, where sensor is present. (NMEA 2000 data source only) | BOBSTAY LOAD |
| Forestay Load | Value Versus Time | Load on forestay in kilograms, where sensor is present. (NMEA 2000 data source only) | FORESTAY LOAD |
| Backstay Load | Value Versus Time | Load on backstay in kilograms, where sensor is present. (NMEA 2000 data source only) | BACKSTAY LOAD |
| Jib Sheet Load | Value Versus Time | Load on jib sheet in kilograms, where sensor is present. (NMEA 2000 data source only) | JIB SHEET |
| Mainsheet Load | Value Versus Time | Load on mainsheet in kilograms, where sensor is present. (NMEA 2000 data source only) | MAIN SHEET |
| Vang Load | Value Versus Time | Load on vang (kicking strap) in kilograms, where sensor is present. (NMEA 2000 data source only) | VANG |
| Cross Track Error | Wind Boat Heading | Cross track error in nautical miles. | XTE |
| COG On Alternative Tack | Wind Boat Heading | Estimated COG if on the alternative tack. | COG ALT TACK |
| Absolute Apparent Wind Angle | Relative Wind Direction | Absolute apparent wind angle. Positive to starboard, negative to port. | ABS AWA |
| Absolute True Wind Angle | Relative Wind Direction | Absolute TWA relative to bow. Starboard positive, port negative. | ABA TWA |
Tab Six : Polar
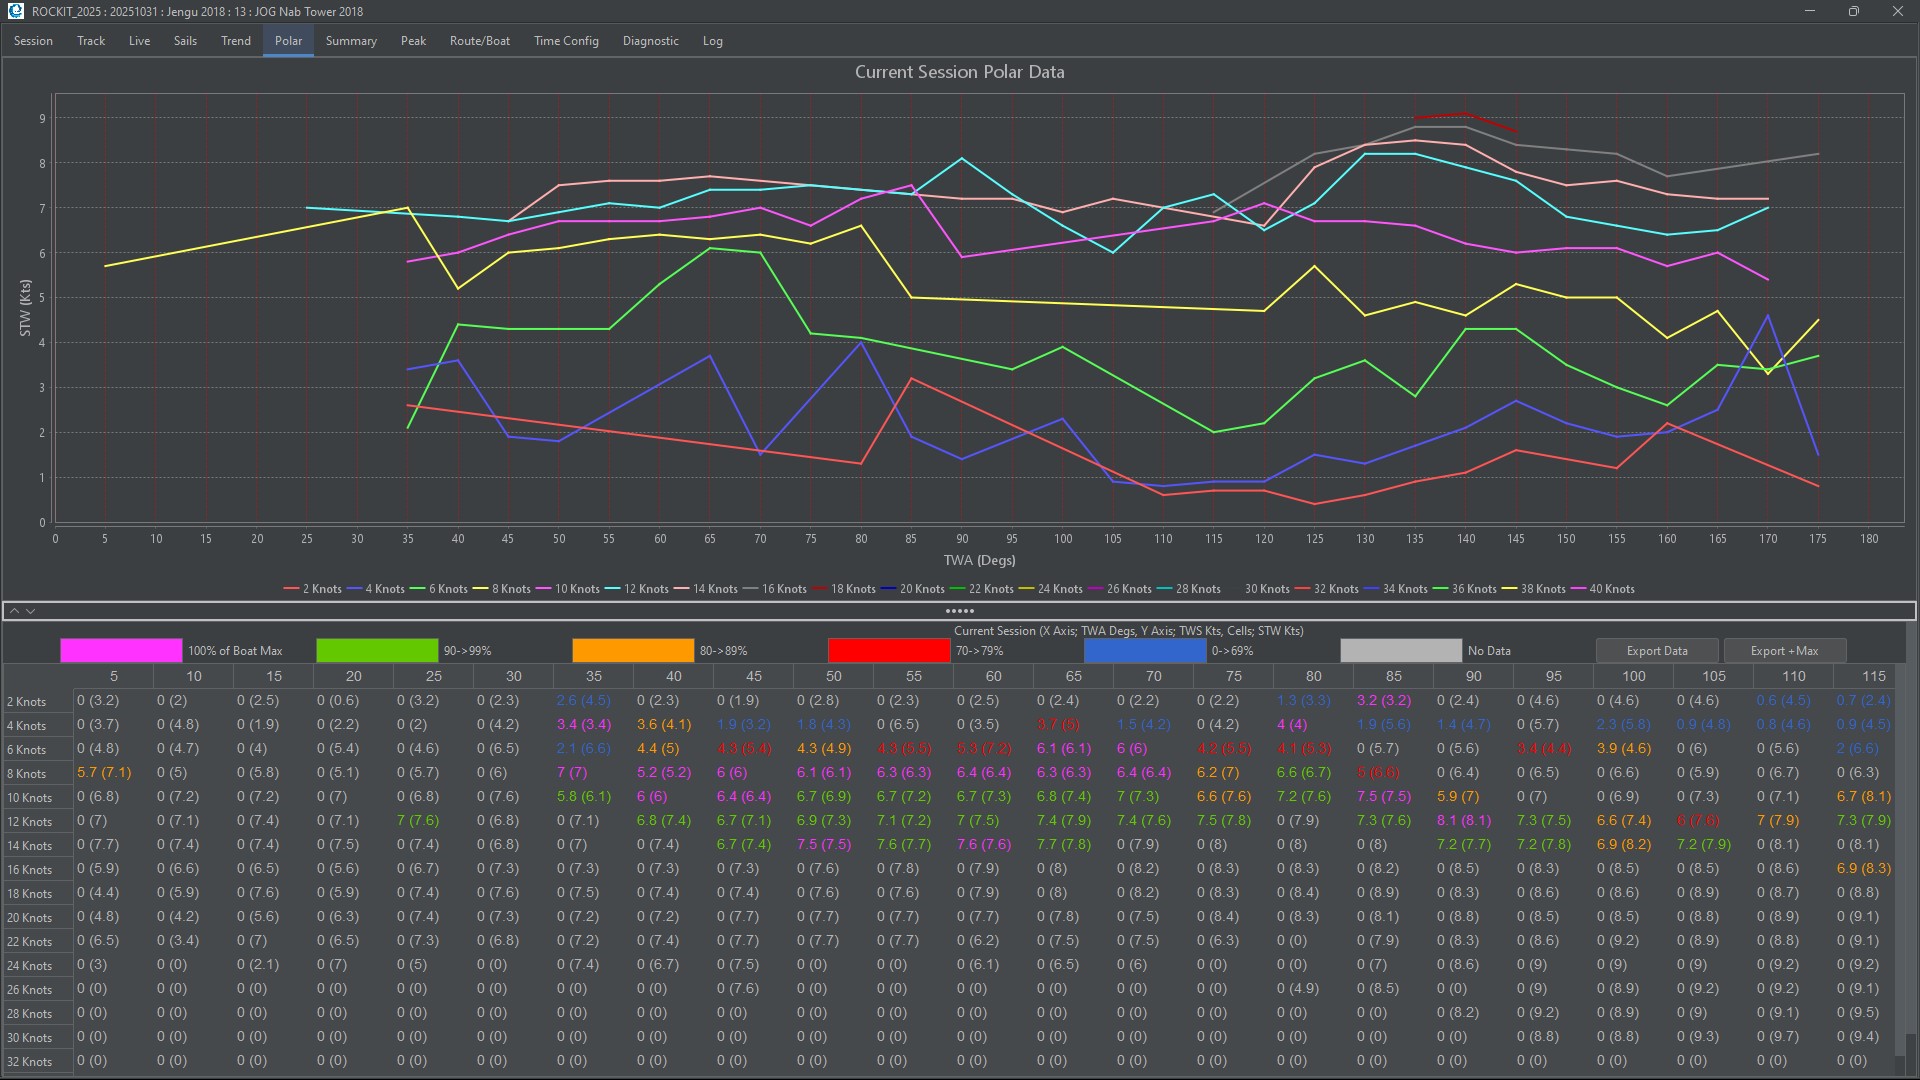
Rockit calculates Polars at both Session and Boat level.
- Boat Polar data is the max value from all the sessions recorded for a boat for a given True Wind angle/speed.
- Session Polar data is the average value to a session for a given True Wind angle/speed.
On this panel we display the Session Polars as a graph and the Session Polar with the Boat value in brackets in the Table.
Session Data Polar Data Graph
Displays plots of the boat speed through the water against true wind speed and true wind angle relative to the bow. The Wind Data is grouped into 2 knot speed bands and 5-degree angle bands. The session value plotted is the average value for the given wind speed/direction/boat speed combination for a session. The number will continue to evolve for the duration of the session. For a given wind speed/direction/boat speed combination corresponding boat values need to have been recorded i.e. if a session has winds only in the 4-6 knots true range and sails just on a beam reach 90 degrees to the wind only those segments will be populated.
Session Data Polar Table
Displays the information from the graphs in table form. This table also pulls in the calculated boat polars. This is displayed in brackets next to the current session value. The numeric values are coloured to indicate the sessions level of performance relative to the boats best speeds. So if the Polar values for the session are in the top 10% the text will be green. If its outside the top 30% the text will be one shade of blue if there is no data for the current session the 0 value and best performance in brackets will be another colour blue.
The boat max value combines the polar values for the boat overall and the VPP data. Boat Polar data is a combination of the maximum values from the session and the VPP. If the boat hasn’t matched/exceeded the VPP values then the max value displayed will be the VPP value.
You can drag the centre horizontal divider up and down to show more of the top or bottom panel. You can save the graph as an image file and generate a csv export of the data in the table.
Tab Seven : Summary
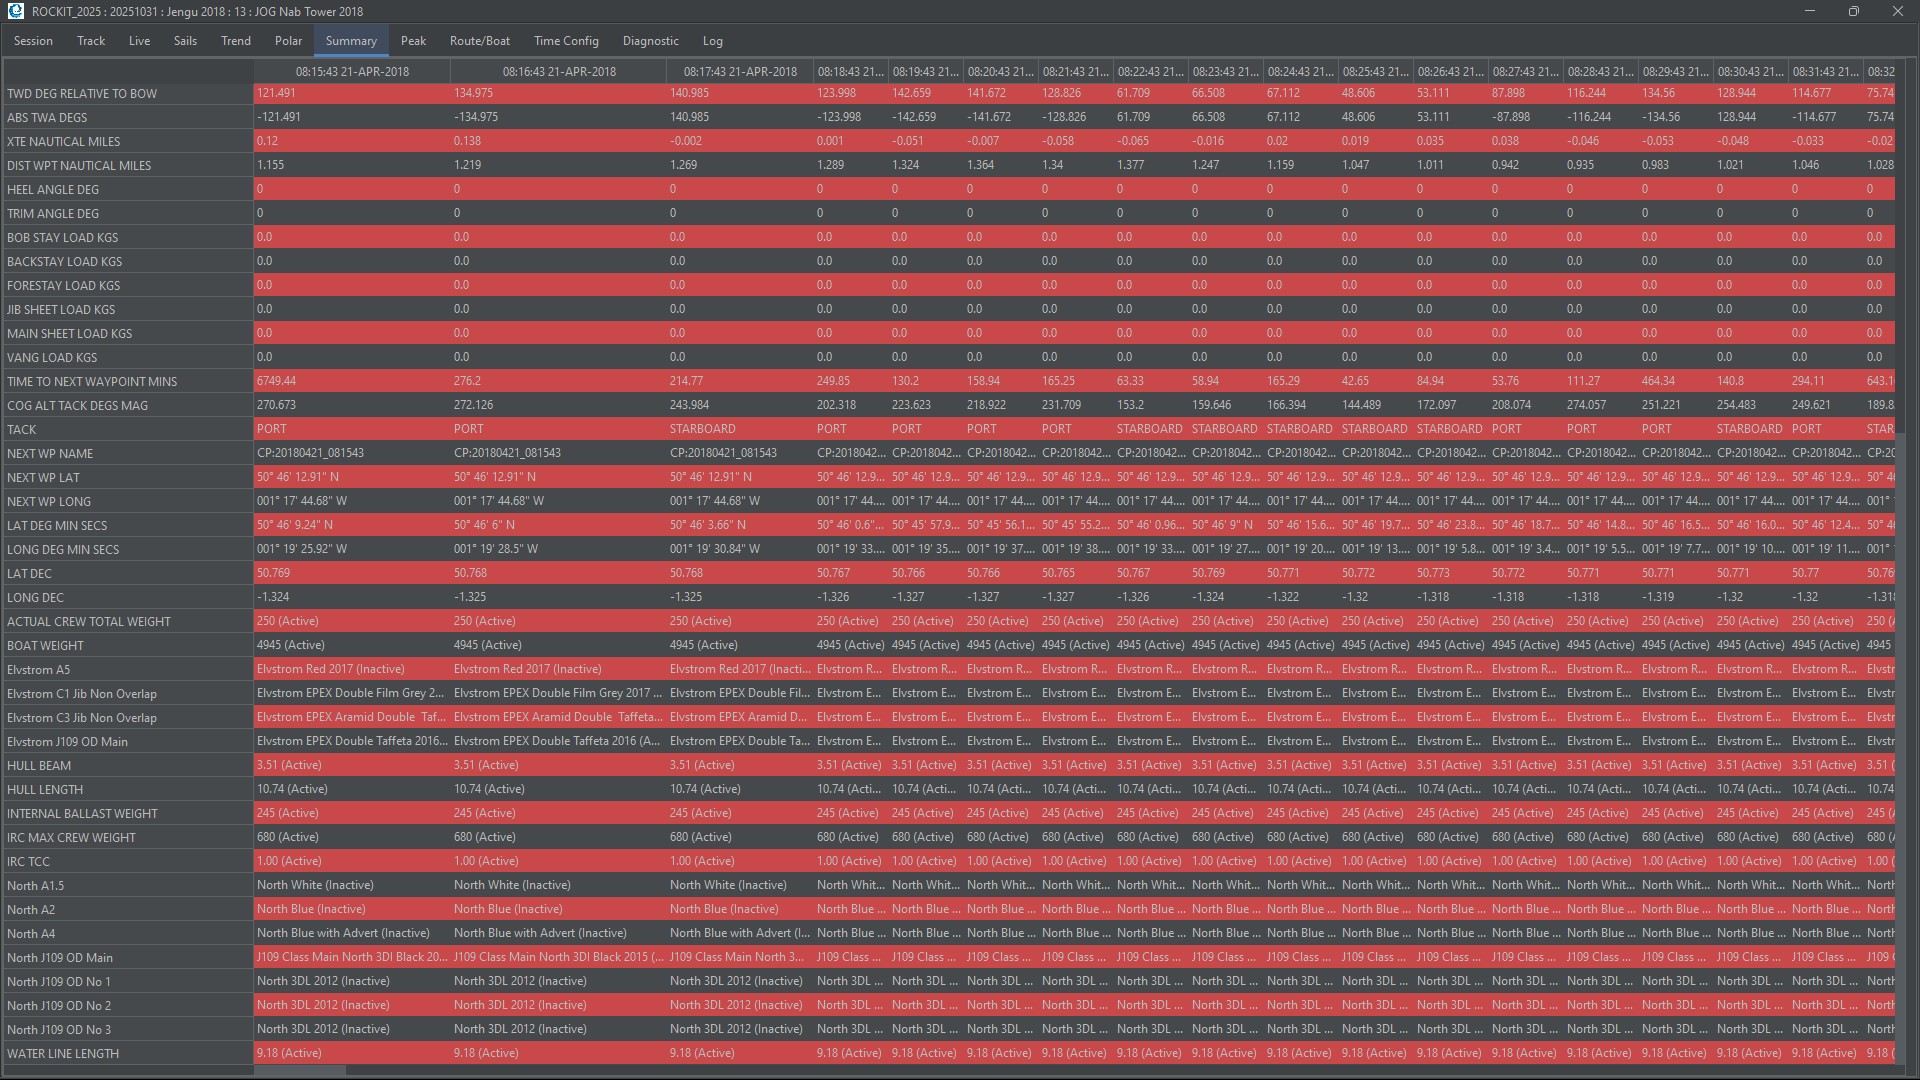
This Tab displays a rolling view of the data.
It shows the summarised data points collected for the last 10, 100, 1,000 or 10,000 sample periods when in recording mode; the number displayed is based on the value selected using the Max Records To Display drop list.
The first 23 data points (rows) are fixed and generated from the NMEA data collected by the Data Collection process. The remaining data points are extracted from the Boat Configuration settings and reflect the configuration settings at that point in time. The configuration settings are user configurable. In the example above “Actual Crew Total Weight” onwards is boat configuration data. Changes to the boat’s configuration made mid-session will be reflected on this table.
There is a column in the table for each timeslot. This is a useful guide to the raw summary data that sits behind the graphs and tables on the other Tabs. This view gives a good idea of which timeslots any erroneous NMEA data might have arrived in. For instance: if you boat suddenly starts to do 100knots through the water for a timeslot then you have probably received a corrupt piece of data from the source systems.
Tab Eight : Peak
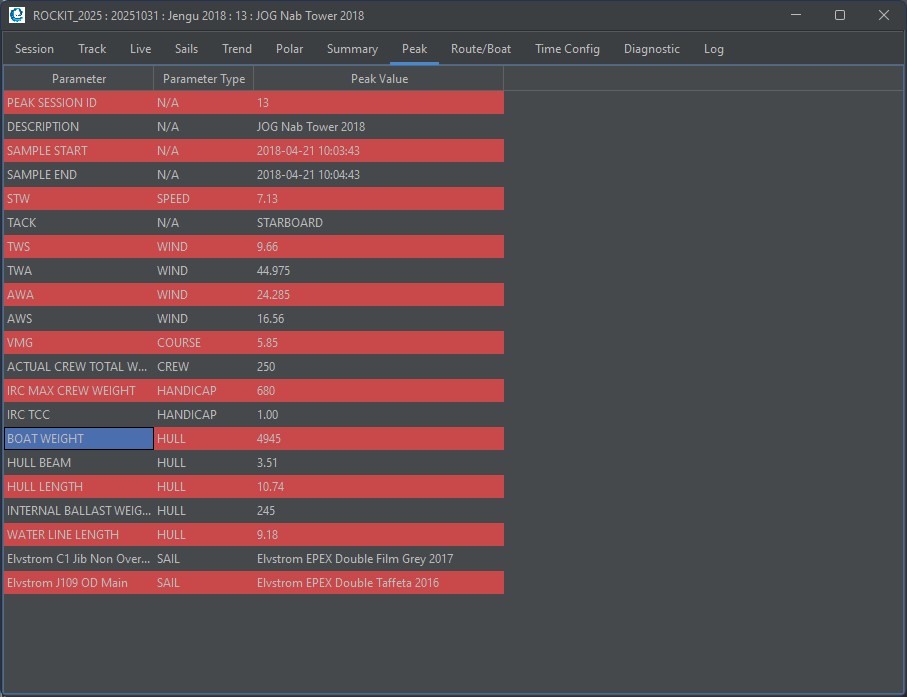
Rockit knows for each True Wind Speed and True Wind Angle the time at which the boat has performed best; it can pull back the boat configuration and related summary data at that point in time.
When recording data this will be automatically update as the screen updates. When reviewing the data clicking on a point on the track will update this panel. Obviously this will only be able to retrieve data where there is a timeslot with corresponding True Wind Speed and Angle values !
Tab Nine: Route/Boat
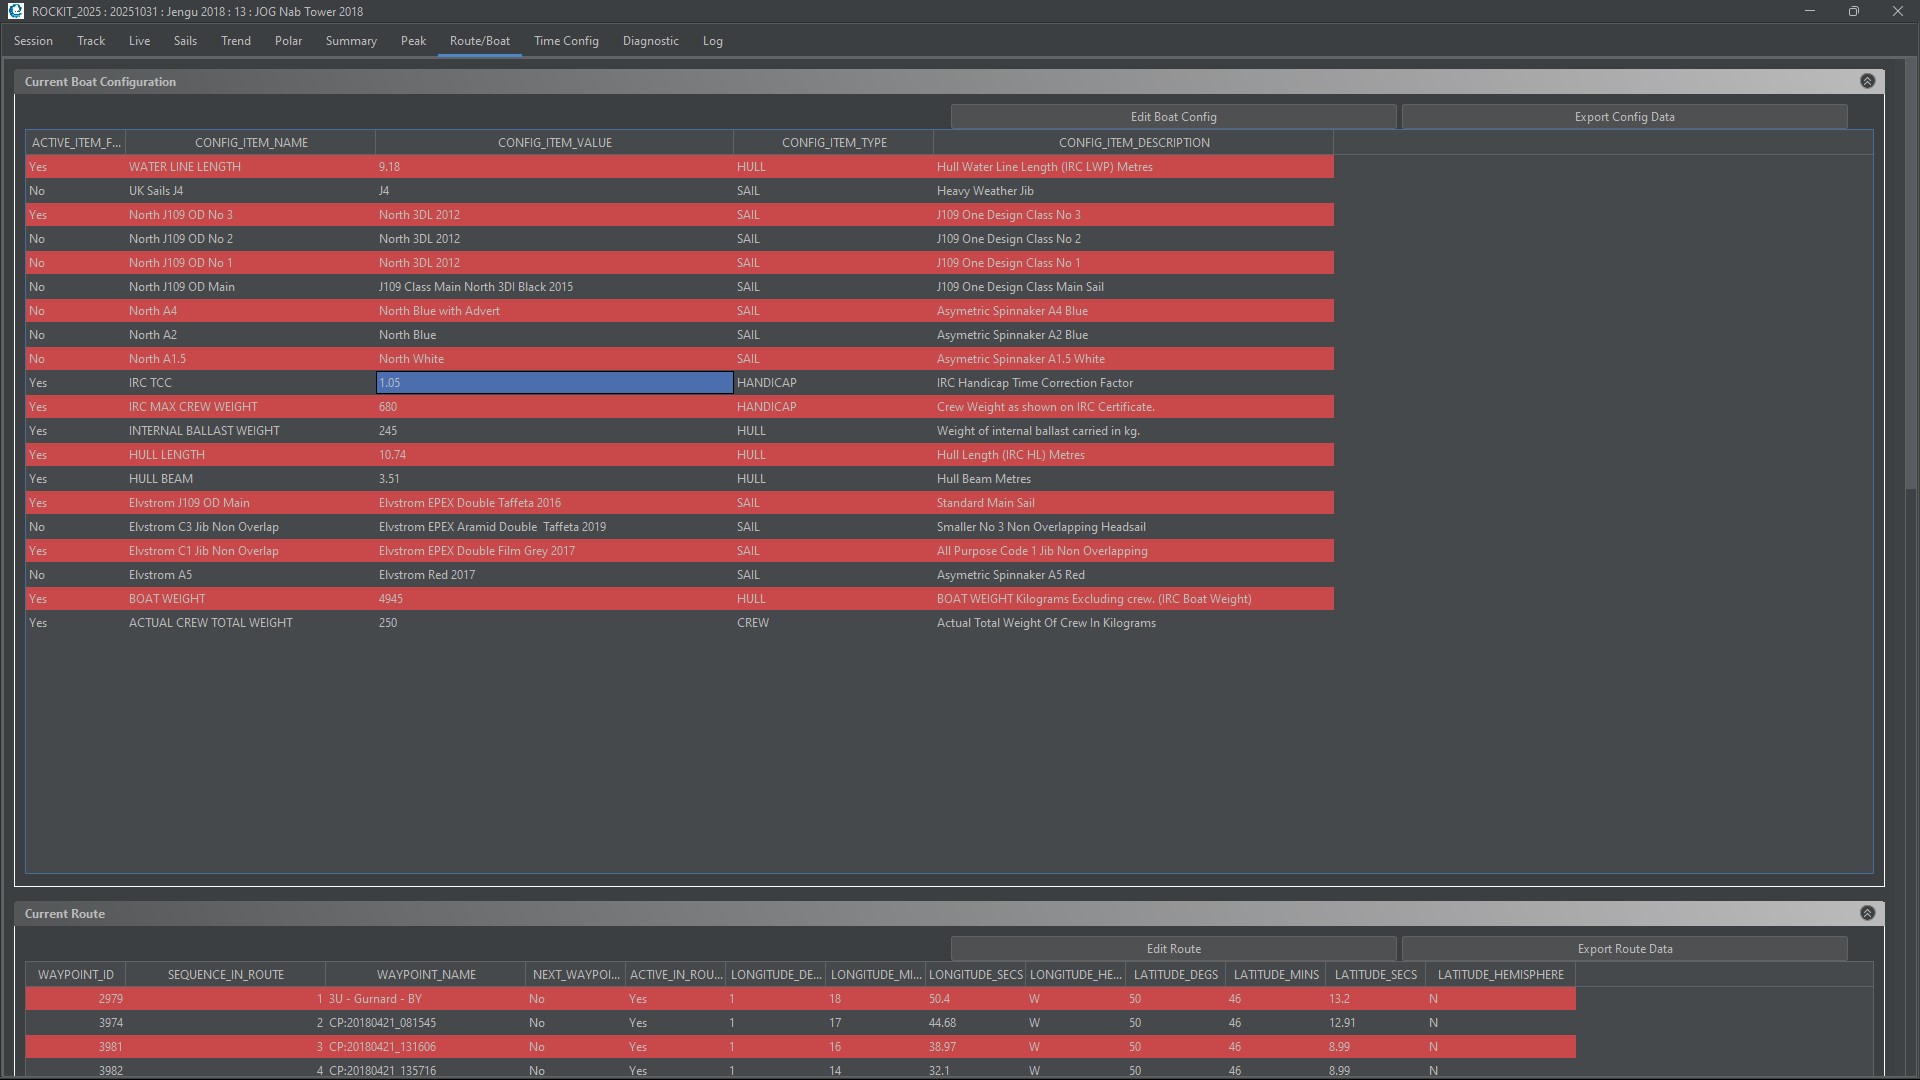
This Tab shows the current configuration recorded for the boat and the route that is being followed. Editing the data on this tab will change the information recorded for the Summary Data.
Current Boat Config Panel
This allows you to set the current active config items. So, for instance, if you want to reflect a change in the boats sail plan you would follow the steps below; To change from using the A1.5 to the A2.
- Select the Active Item Flag Field for the currently active row (the A1.5), and use the drop list that appears to set it to “No”
- Select the Active Item Flag Field for the new active row (the A2), and use the drop list that appears to set it to “Yes”
Stepping off the record so that the drop list disappears will say the changes to the Rockit database.
You can also edit the Config Item Value by double clicking in the field. Once you have made your change step off the record to save the change to the database.
This feature is useful for recording things like the current Helmsman. So the config Item Value would go from “Bill” to “John” and that would be reflected in the recorded config item data. Rockit uses this Boat Config Item data as the basis of the information it records for each Sample Timeslot. It stores a copy of the Boat Config Items state at the point in time of the Sample Period. Retrospectively editing the Boat Config Item information stored against the Sample Periods is possible as part of a bulk edit and will be covered later in this article.
You can also from here open the Boat Edit screen or export the boat current configuration to csv file.
Sail Config Items and Performance Plots
Sails are defined as Boat Config Items. So our test J109 has a set of 7 sails defined; A1.5, A2, A5, C1, C3 etc.
The sail performance graphs are generated using this information. So boat performance will be extracted for the sample periods where a sail (e.g. A1.5) is active. Its clearly important to make sure the correct sails are active for the correct set of sample periods otherwise the sail performance data will be inaccurate. Our approach is to review the sail usage as part of our post race analysis. We compare our track (windward/leeward etc) with the sail data on Boat Configuration Tab on the diagnostics tab later. Where the two don’t match up we can edit them using the Bulk Boat Config Edit panel (described later in this guide).
Current Route Waypoints Panel
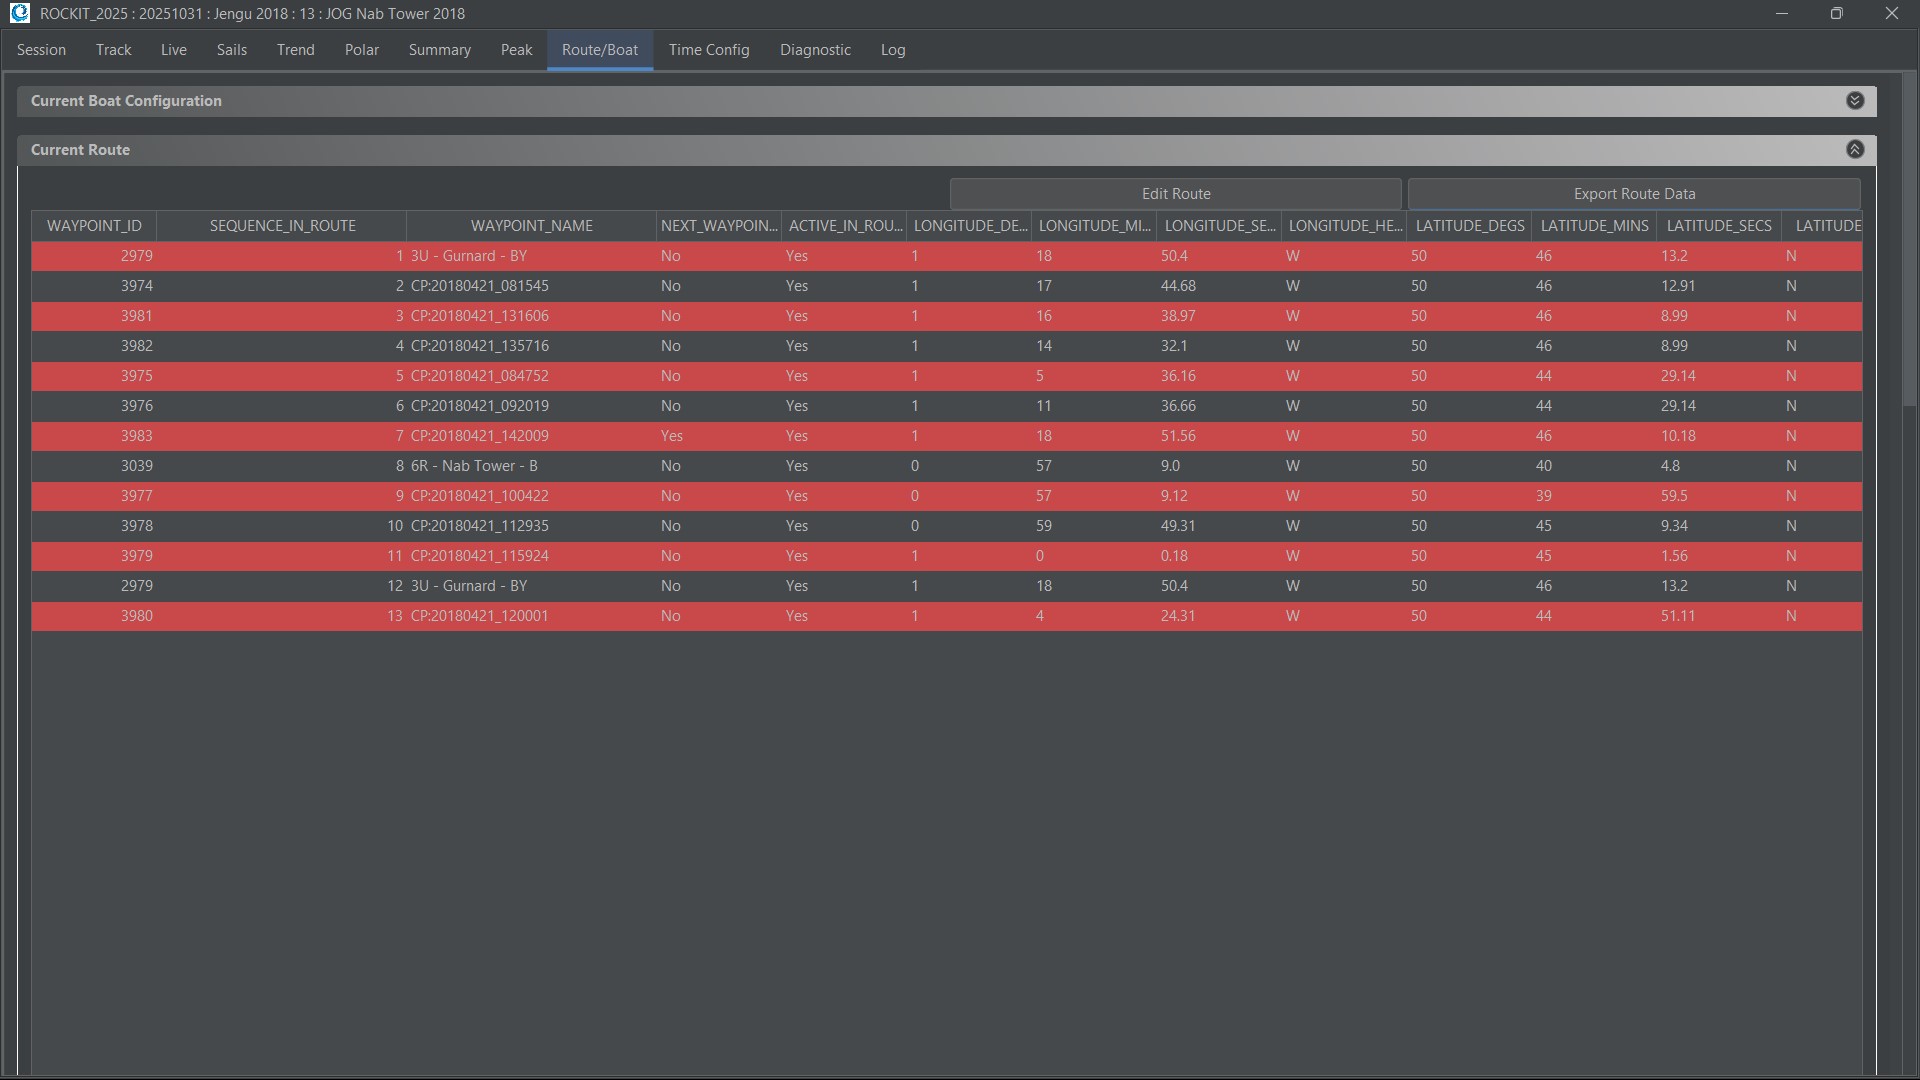
This shows the route that the boat is set to follow and its current next waypoint. As with the Boat Config Items you can edit the active status of a Route Waypoint – you can have a Waypoint in the route sequence that is inactive, for instance, because you decided to by pass it. You can also edit which is the next Waypoint. Stepping off the record will save the change to the database.
You can also open the full Route Edit screen or export the route to csv file.
Tab Ten: Time Config
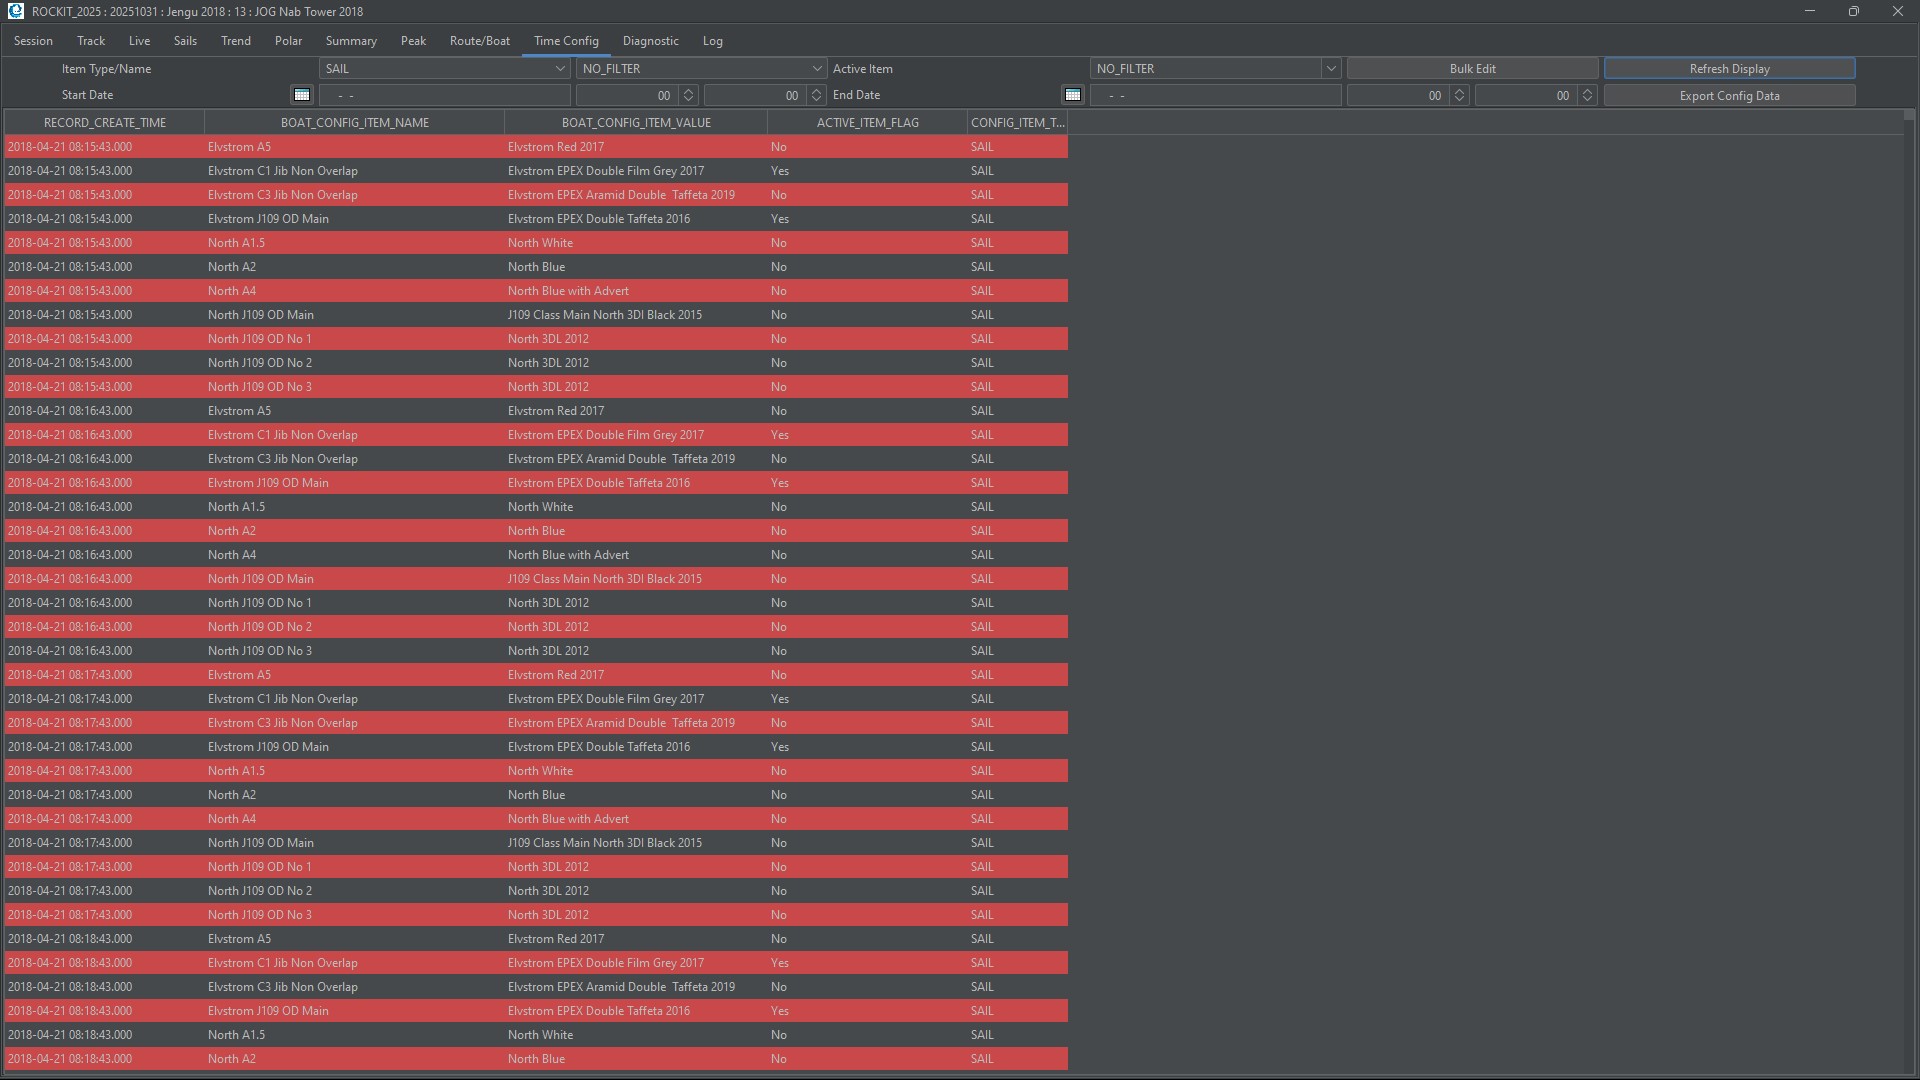
This panel makes it possible to retrospectively edit the detailed Boat Config Information for each or multiple timeslots;
Use the filters and fields to select the Items that you want to update. Then press the “Bulk Update” button. That will open the actual screen for editing the data. For instance if you want to make the A1.5 active between 9am and 9.30am on the session recorded on 21-April 2018 setup the query panel like that in the image below then press “Refresh Display” to update the displayed information.
That brings up only the A1.5 records. Press “Bulk Update” to open the Bulk Update Screen. You will need to enter a date in the Start Date/End Date boxes and pick a Config Item Name before the bulk Edit will open.
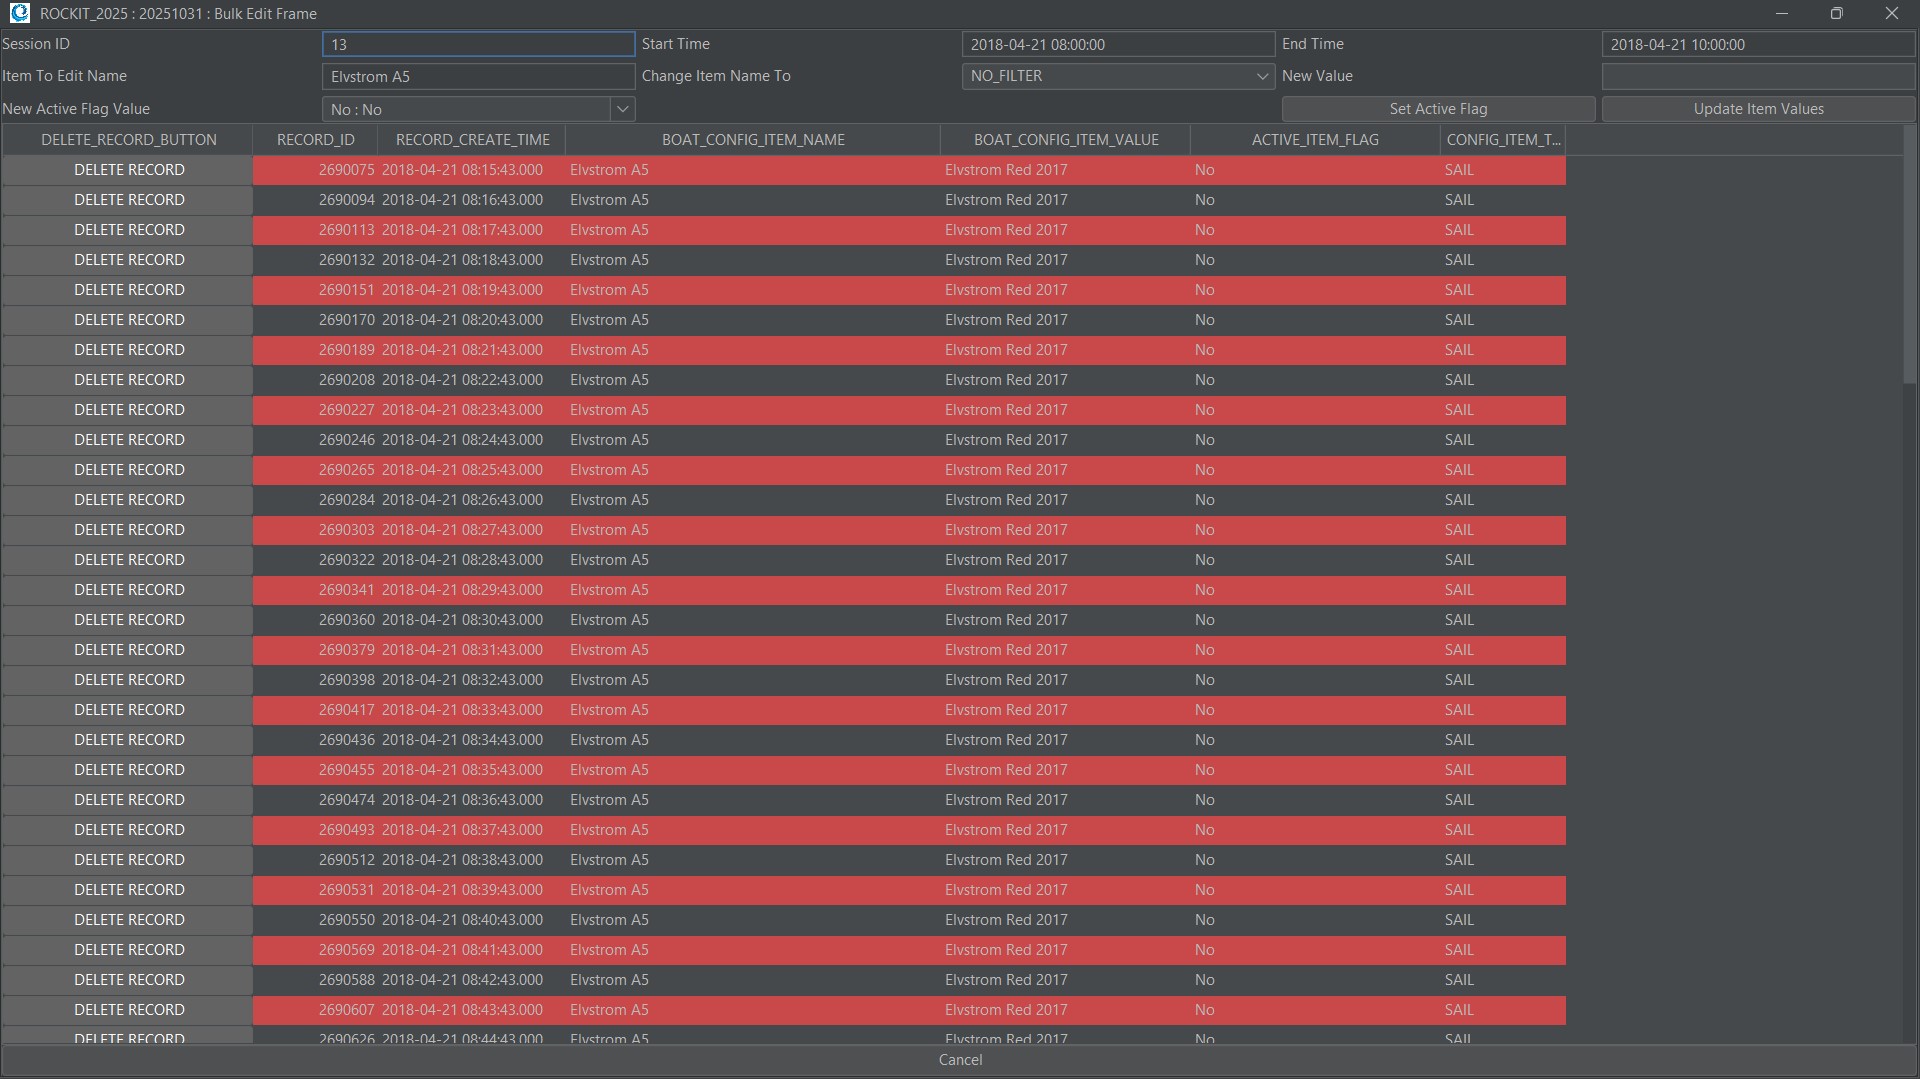
Set the New Active Flag Value to Yes and press “Set Active Flag”. That will update the Active Item Flag for all the displayed records. In other circumstances you might want to change the Config Item Name or Value, for instance. for something like the name of the Helmsman. Use the New Value and Change Item Name To fields to do that and press the “Update Item Values” button to apply the new values to the selected records.
Press “Cancel” to close the Bulk Edit screen and “Refresh Display” on the original screen and the values for the Sample Periods Boat Config Items should be updated.
Tab Eleven: Diagnostic
The diagnostic data tab contains panels that make it possible to review and edit the data that Rockit has captured.
NMEA Data Panel
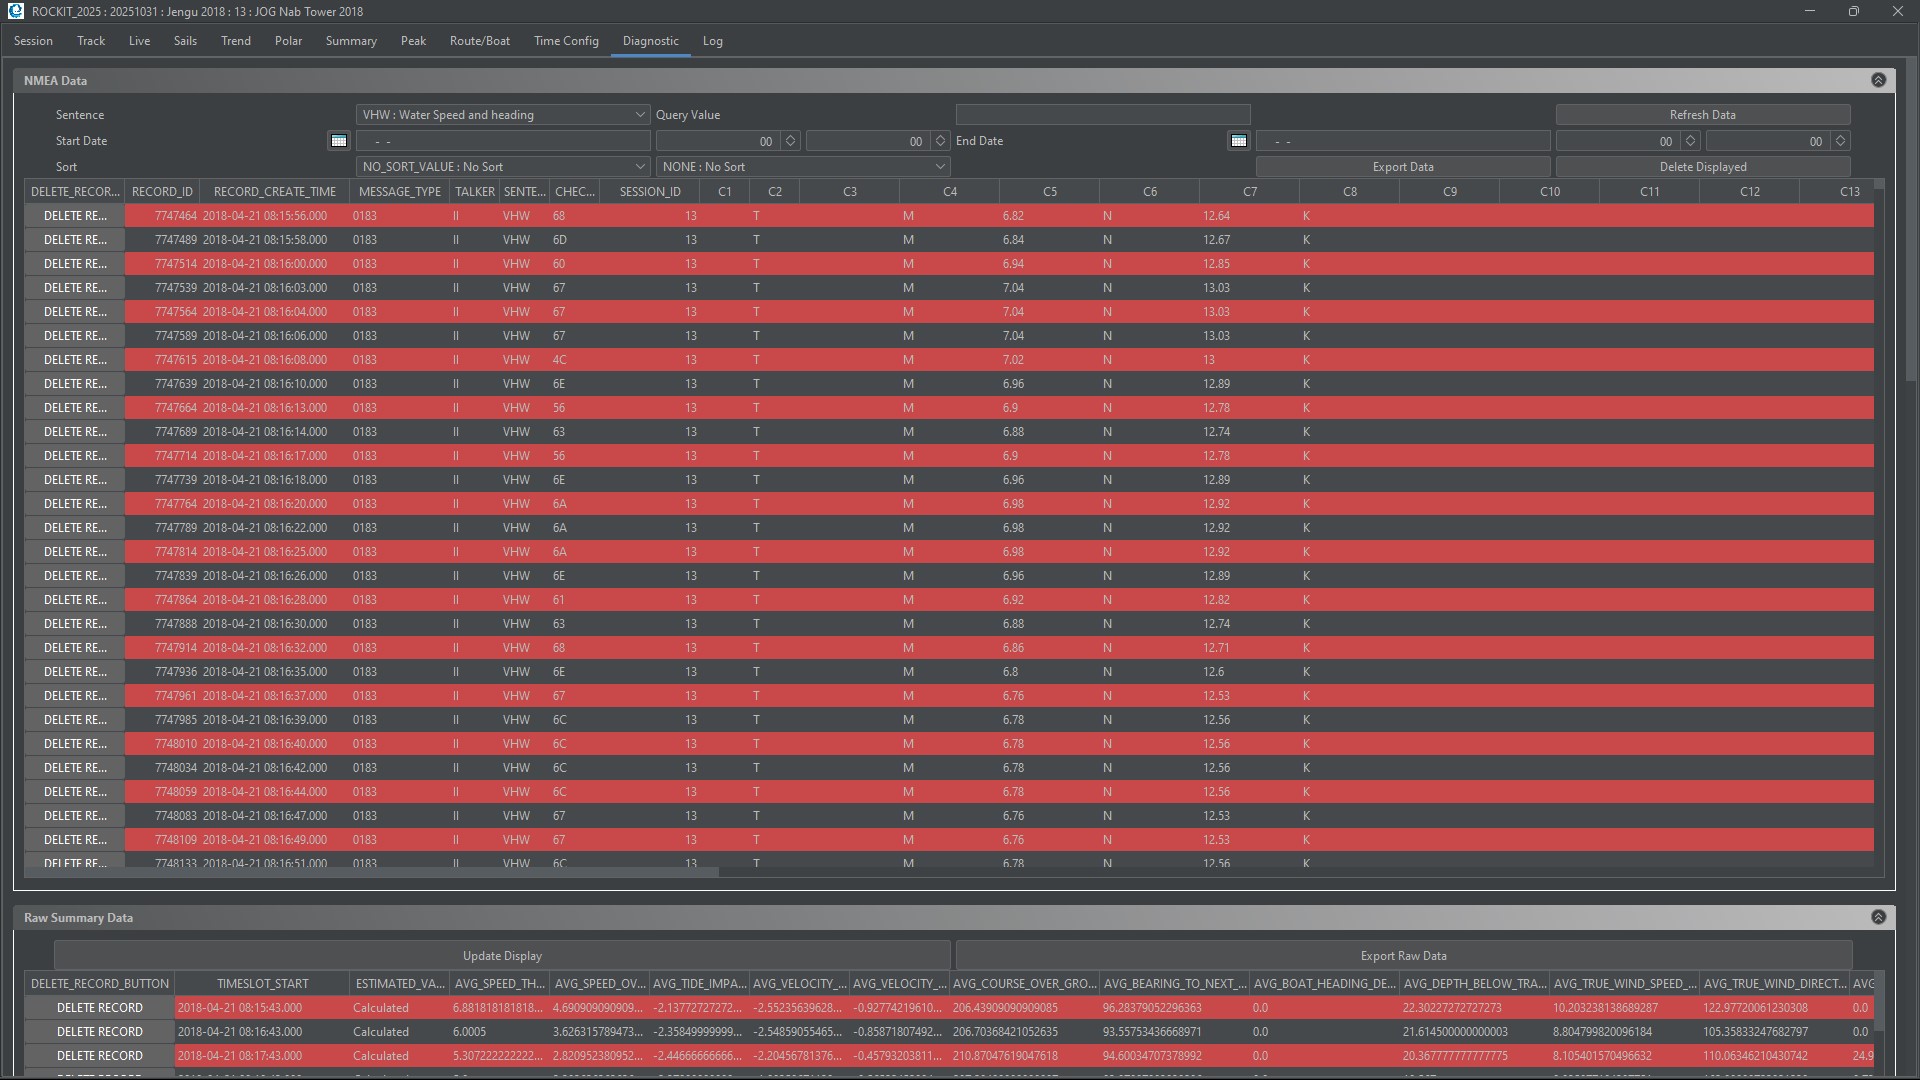
Displays the information that the Rockit has derived from the NMEA messages received and loaded into its database. Each row in the list represents a single message received.
Rockits NMEA Data table contains basic information about the sentence and a set of fields to represent the data points in the messages, The aim with this table was to collect enough information to drive the calculation process that drives the summary and polar data creation. In theory an NMEA 0183 message can contain up to 50 data points so we should have 50 data columns in the table. In reality we found that the message types we were collecting only required 40 columns maximum. NMEA 2000 messages are collected in a similar way with the messages being broken out into their sub-components and stored in individual fields.
The Sentence name drop list contains the sentence names that are used in the calculation process. Rockit can be set to run in two modes. One where all the received messages are collected and stored or one that only stores the messages that are required in calculation. Unless you have another use for the data outside of Rockit there isn’t anything to be gained by collecting and storing message types that we don’t use for calculation. There is a parameter value set to force Rockit to collect all inbound sentence data.
The following functions can be applied.
- Filter by Message Type. The Sentence drop list at the top of the screen filters the sentence displayed. Only one type of sentence is displayed at a time unless “No Filter” is selected. Once the Sentence has been selected in the drop list the ‘Refresh NMEA Data’ button needs to be pressed to update the data displayed.
- Sort By and Sort Order. Use these values to sort by something other than the default sort on the Record ID Column. Sort by is the name of the column to sort by. Sort Order determines whether you are sorting Ascending or Descending on that column.
- Filter by Date and time the message is received. The Start Time and End Time can be entered using the dialog boxes. Pressing the Refresh NMEA Data button will then return the message that appear within a specific time period.
- Filter by Value. If you know the value that you are looking for you can use the query value field to filter on. As with the previous filter types press the Refresh NMEA Data button to return the filtered records.
- Filter by a combination of Time, Value and Message Type. The different filters can be used at the same time to make an even finer grained filter.
- Deleting Single Messages. We found on our test boats that occasionally messages would get corrupted and that it was useful to be able to edit or remove the erroneous values. We found that the erroneous data would cause spikes in the Polar and Wind/Boat speed profiles. Pressing ‘Delete’ will permanently remove the record from the database
- Deleting All The Displayed Messages. The Delete Displayed Data button will remove all of the currently displayed NMEA records from the database. This is particularly useful if for instance you have recorded data whilst motoring at the end of a session. You can use the time filters at the top of the panel to select the records between a get set of times, then use the Delete Displayed Data to remove all the records for that time span.
- Editing Data Values. It’s also possible to edit the individual NMEA message records. Rockit will filter out a lot of data corruption, but some elements will inevitably still get through. Clicking on any of the cells in the table apart from Record ID, Created Time will allow you to edit the value. Having made the change click on another cell in the table to save the data update to the database.
- Recalculation Of Summary Data. Once you have removed/edited the values you don’t like you will need to recalculate the summary data. This is achieved using the ‘Recreate Session Summary’ button on the Session List screen. If you have a long recording session it can take some time to recalculate all the summary data values. You will not be able to record from the NMEA source until you have finished the recalculation processing.
Raw Summary Data Panel
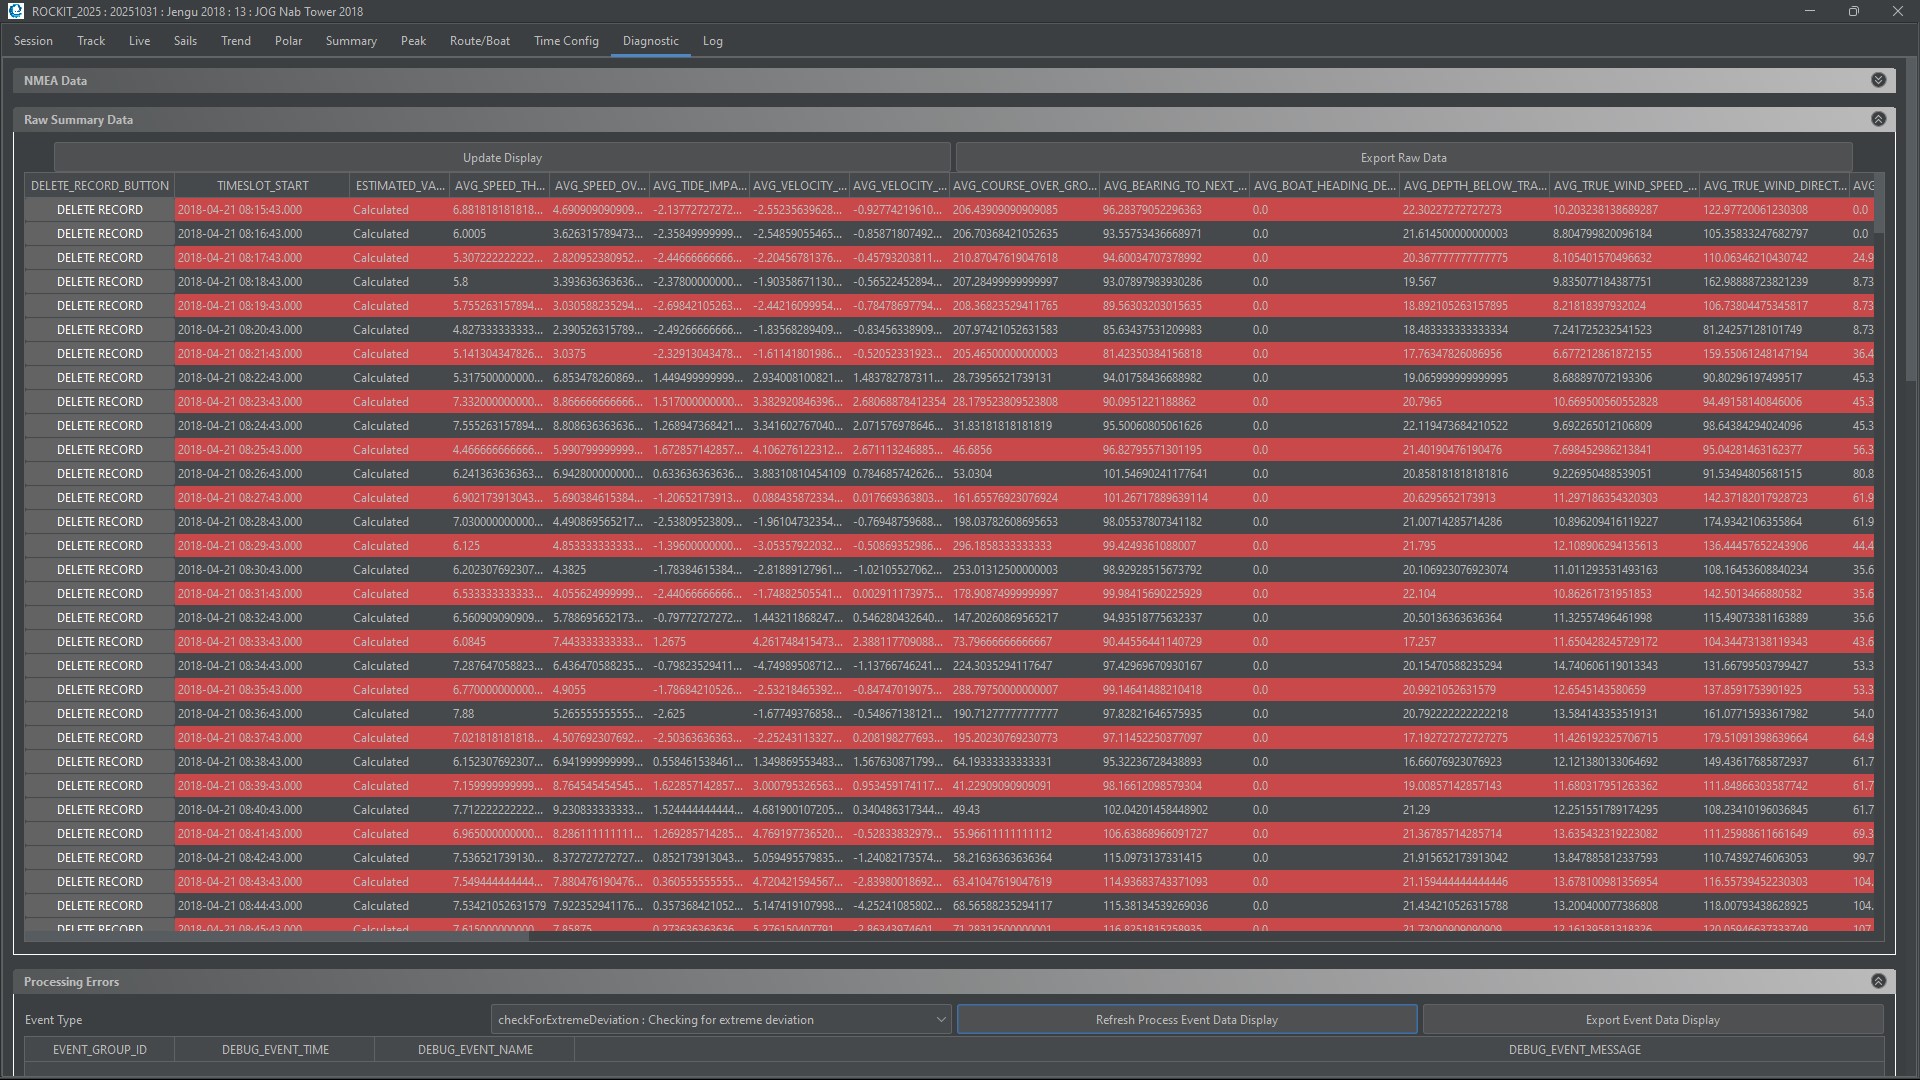
The Raw Summary Data Panel displays the data calculated by Rockit from the incoming NMEA Data feed. Effectively it is a different more limited view of the data on the processed summary data panel. Unlike the Processed Summary Data panel the timeseries runs down the page, each row represents a timeslot. Its is also possible to edit the values on this panel. Whilst its better to perform a complete recalculation of the data, something that is described elsewhere in this guide if you are looking for a short term fix for one of the graphs editing the summary data can be useful.
Making changes to the Raw Summary Data will not affect Polar data for a session or boat as that requires a complete recalculation of a sessions summary data to affect.
Editing values is simply a question of clicking in the cell for the number that you want to amend, making the change then stepping out of the cells by clicking elsewhere. Clicking out of the cell will force the change to be saved to the Rockit database. Once you have completed the edit use the Update Displayed Data button on the left hand panel to update the information held on the screens.
You can also;
- Export Raw Summary Data. You can export the Raw Summary Data as a csv file using the Export Raw Data button.
- Update Display. Pressing the update display button will update the screen display.
Processing Errors
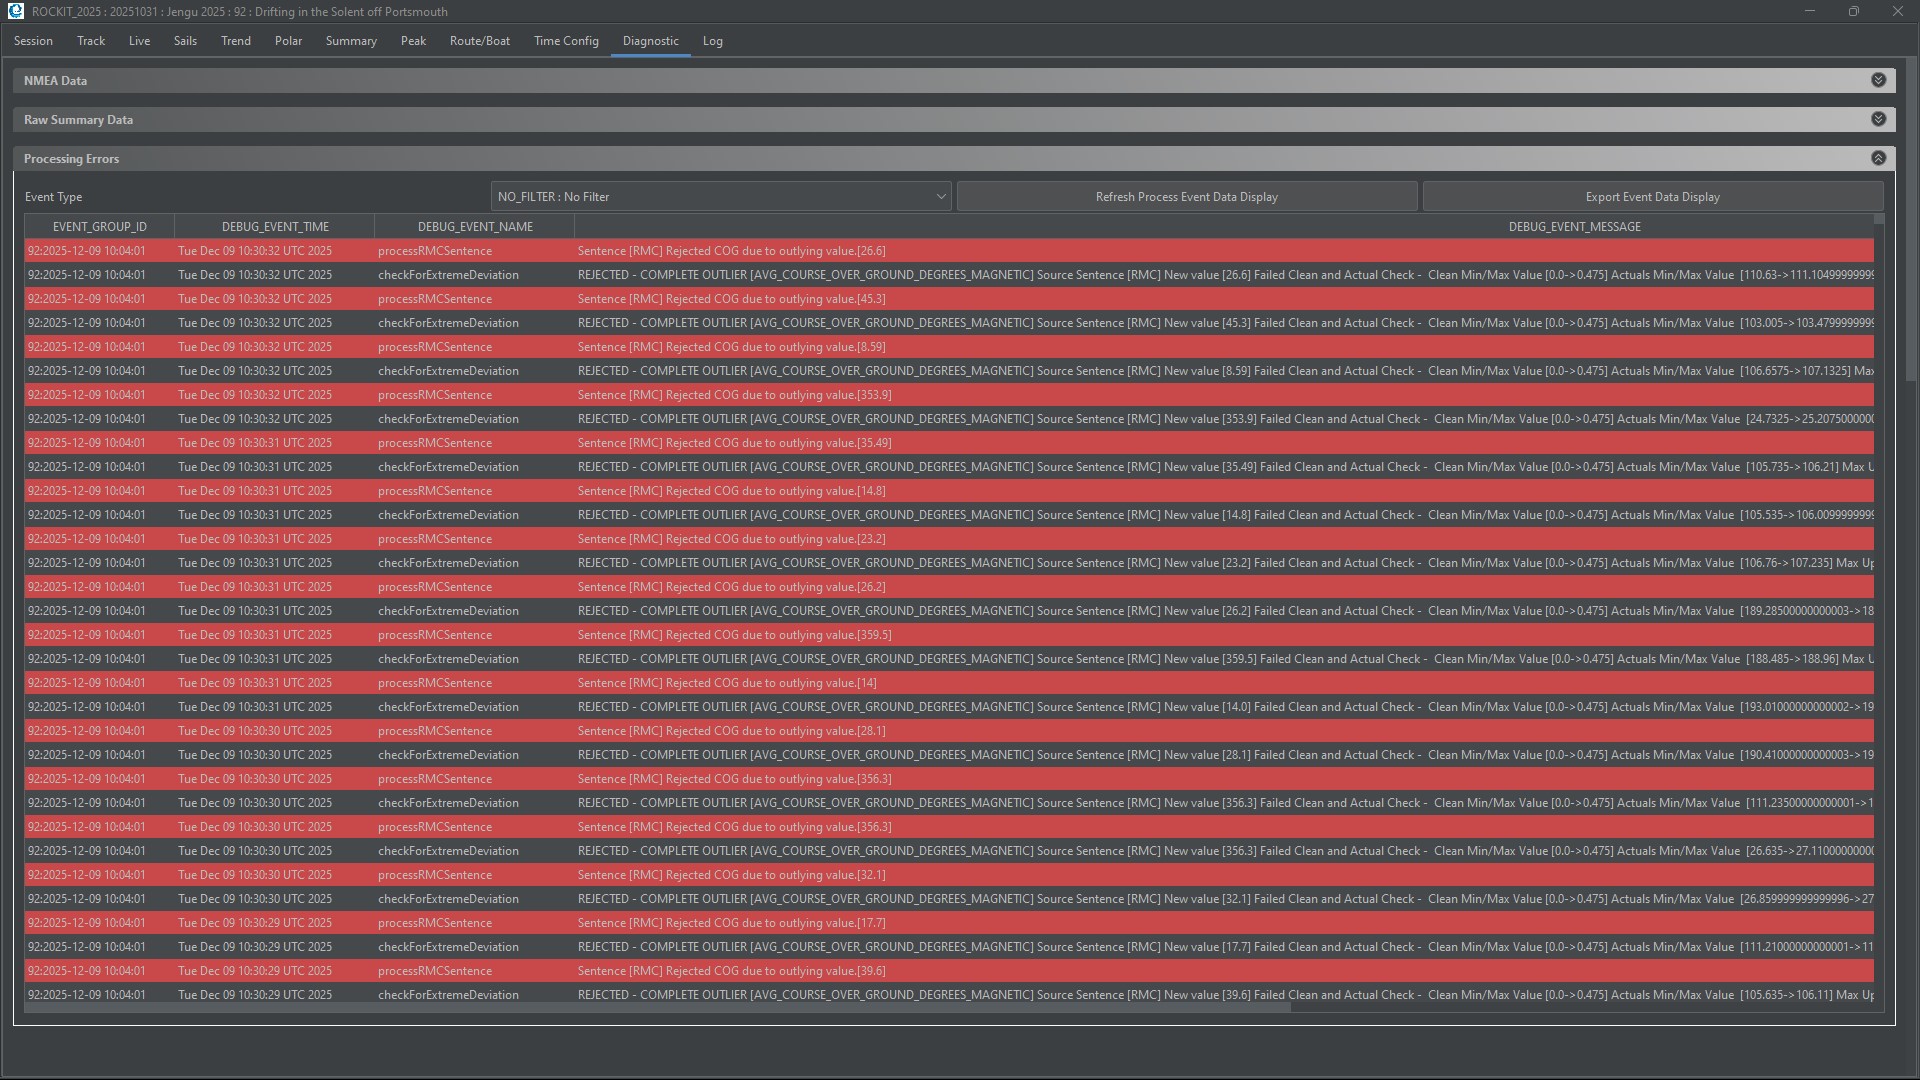
A lot of data errors will be picked up in the process of collecting and aggregating the data from the NMEA Messages.
A subset of those will be written to the a table called Debug Event. This list of errors for a session can be viewed on the Processing Errors panel.
Most of the errors are quite technical. If you are experiencing difficulties collecting data then the explanation is likely contained on that panel. You can Export the rows for a session using the Export Processing Errors button that will create a csv file of the errors that can be sent to Rockit support via email. Email support@ashtree-marine.com
A note on Purging Debug Events. Over time the Debug Event table can get very large and that will slow the processing of the Rockit data. You can use the Purge Debug Data button on the Session List Screen – Session Utilities tab to clear all but the most recent data out of the Debug Event table. If there is a lot of data in the table this may take some time. Once deleted the Debug Events cannot be retrieved.
Tab Twelve : Log
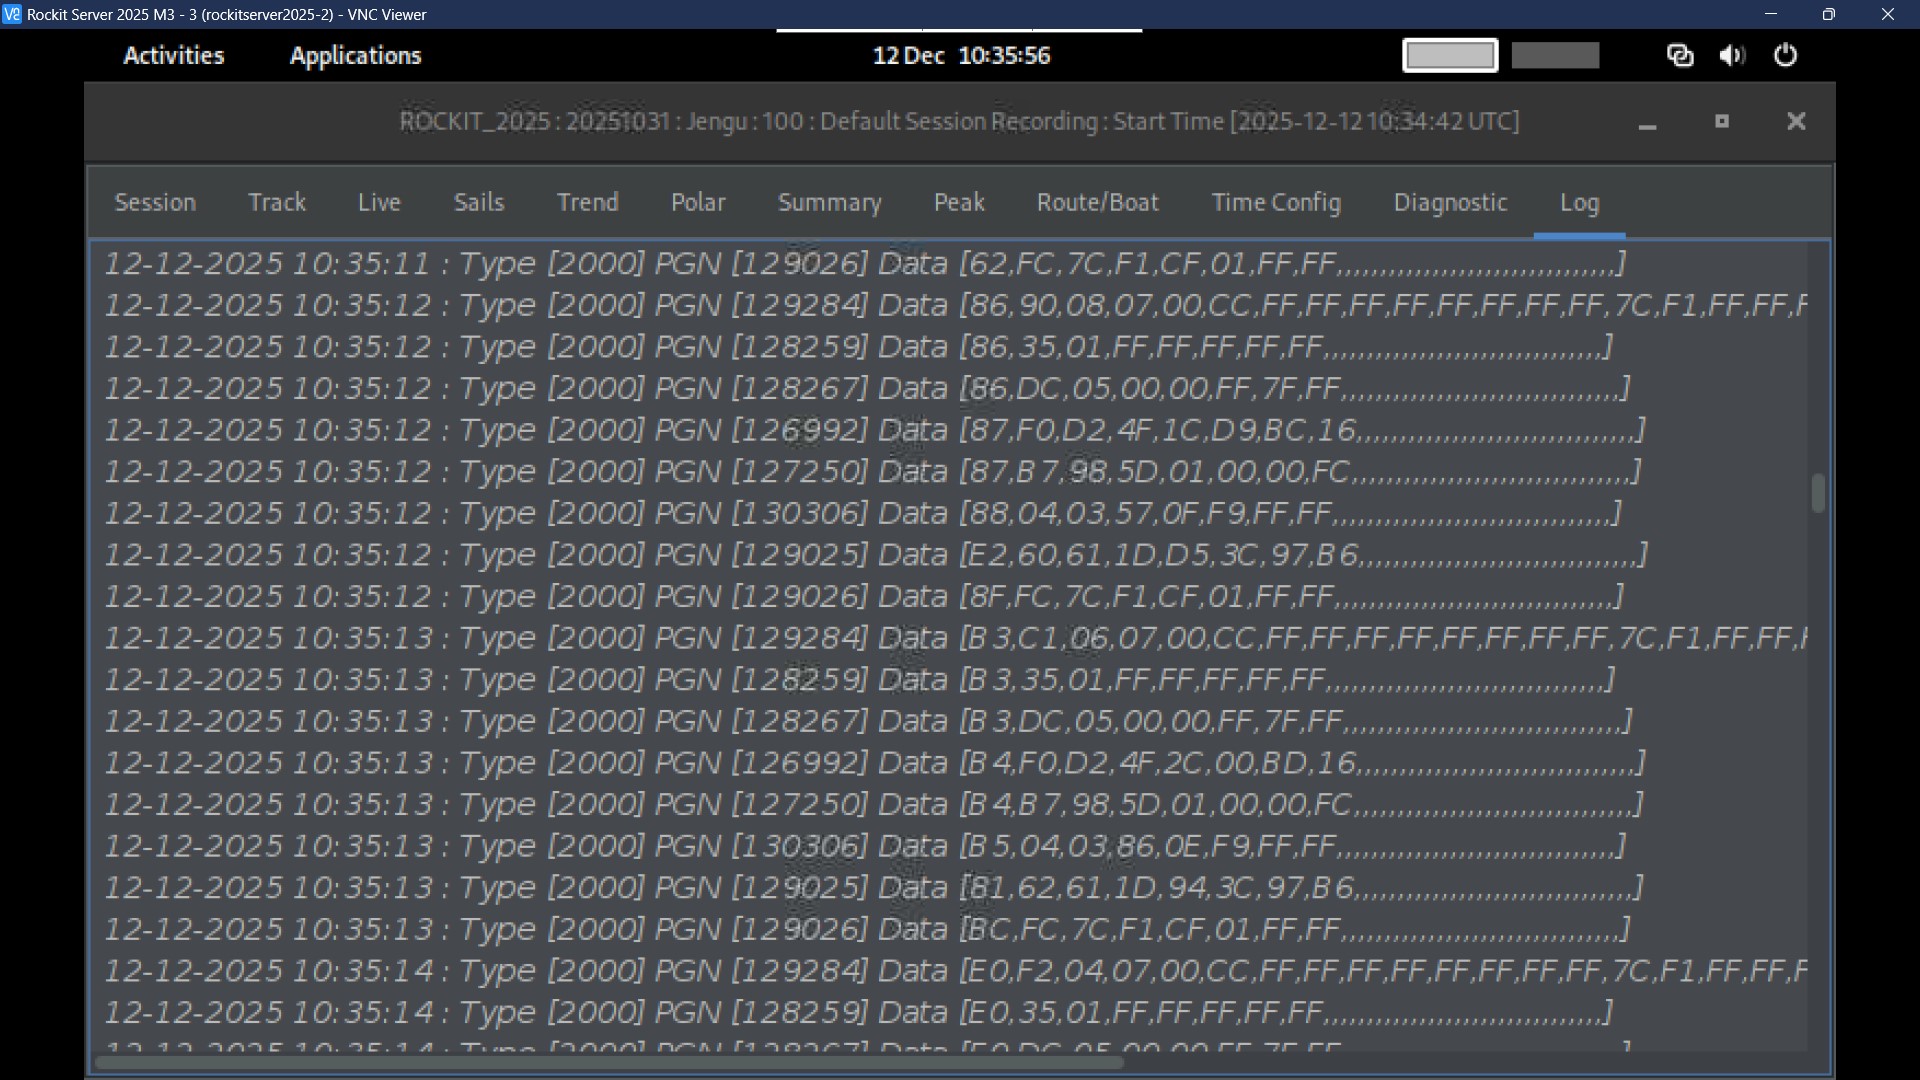
The final tab will display logging information as data is collected. In this case running on the Rockit Server version of the software viewed through VNC viewer you can see the NMEA 2000 messages that the server is receiving. They will be extracted and stored in the NMEA data table.
Problems connecting to a data source will be visible here as will error messages that are generated.
Once the recording session finishes this log output will be lost. It mostly exists as a “am I collecting data” check.
Notes On How To Use The Graphs
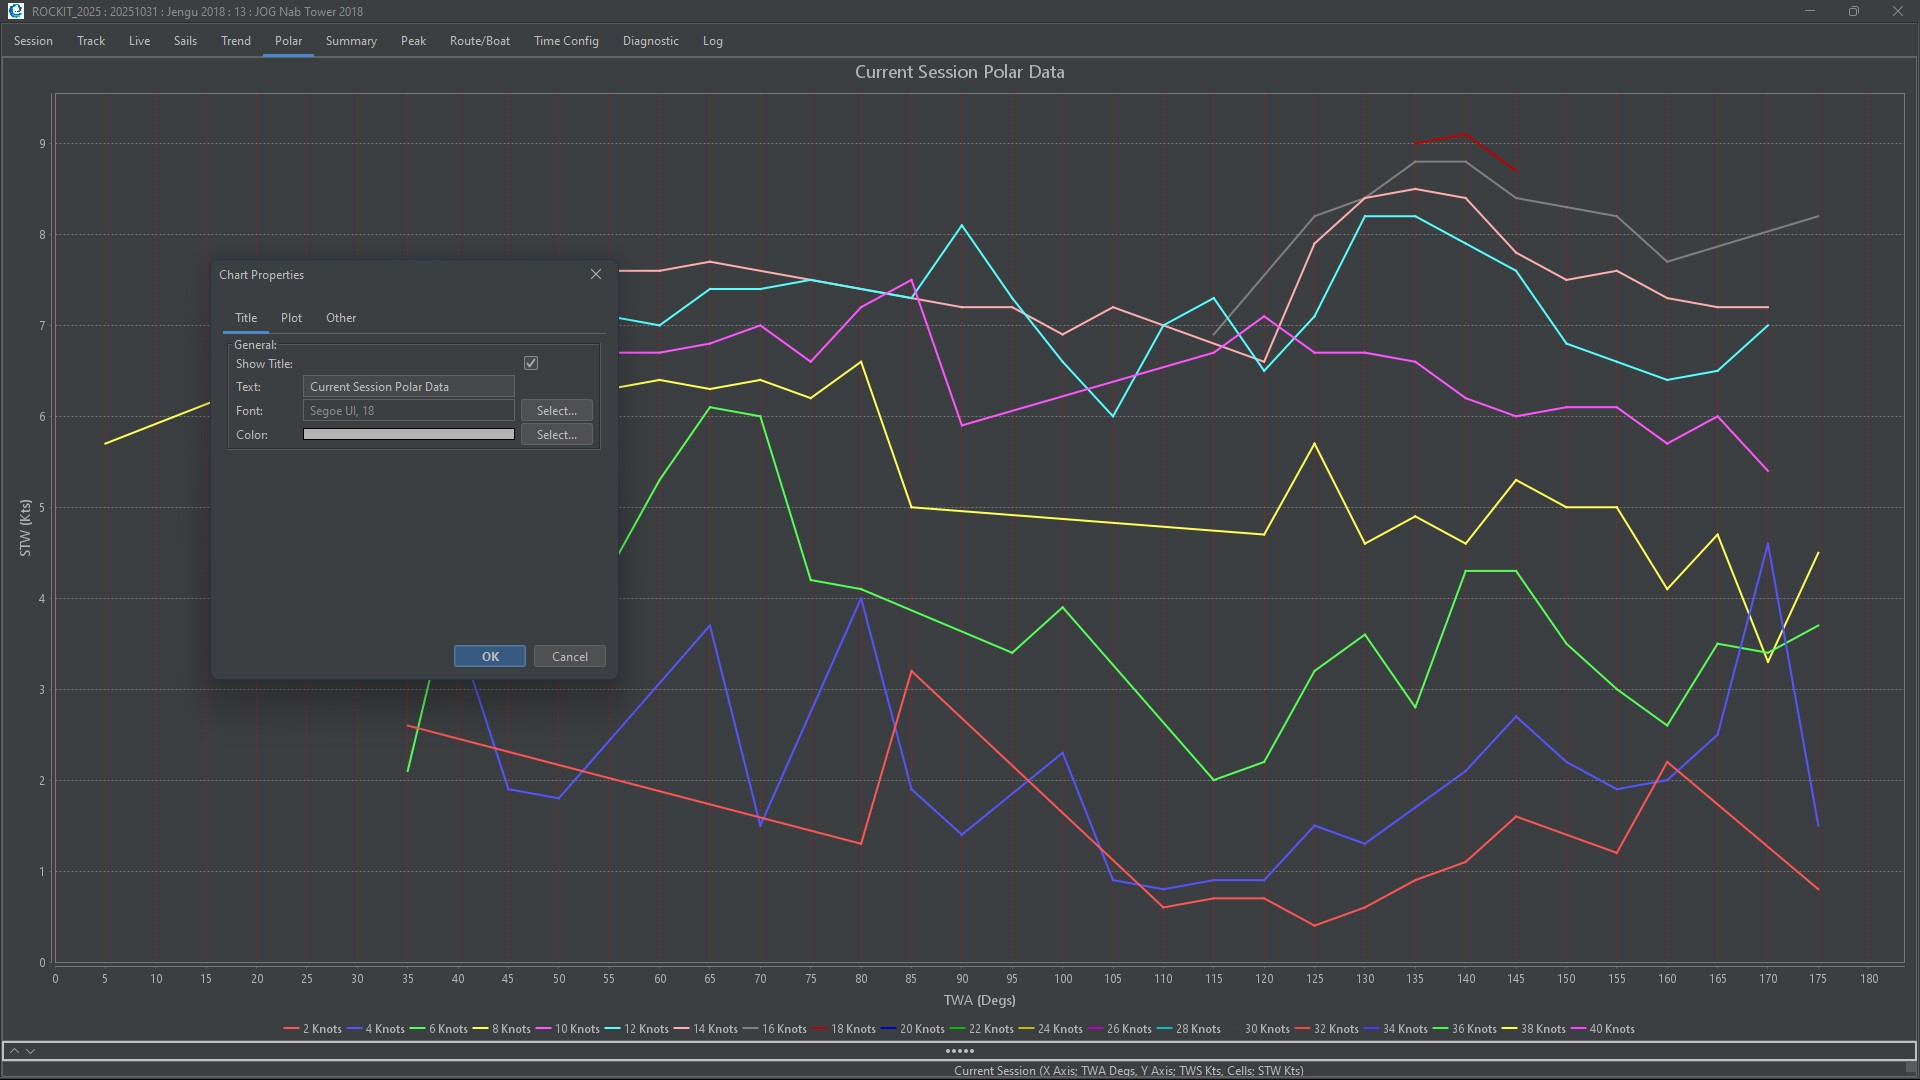
If you right click on the actual graph you will get a context sensitive menu appear. This gives you the option to both save the graph as a .png file, Zoom in and out on the graph axis and so forth. It also gives you the option to modify the graphs visual properties; change the way that the graph is displayed. For instance; you can rotate the axis, change the font, background colour and so forth.
Its worth noting that the original properties will be restored when you update the sail plot the change in appearance is not stored for future use.
Each individual graph panel can be manipulated in this way.
Summary
For the 2025 edition of Rockit we have brought the Rockit Server and Desktop versions of the software into alignment. So the base functionality is now the same for both versions of the product. For the 2025 Edition we have reworked the screens and amended the colours/layouts to make them as user friendly as possible.
The core functionality is essentially the same as 2023. We like to think we have just made the whole thing easier to use.
Any questions please feel free to get into touch using the link to the contact page below;