Overview
Once you have connected the Rockit Analytics software to your boats NMEA network you need to tell Rockit about the boat.
Thats a relatively simple process you can record as little or as much about the boats configuration as you like. To get the most out of Rockit you will at least need to record the details of the sails that you are using as that information will be used to generate the sail cross over charts we talk about later in this User Guide.
Boat configuration involves the following steps;
- Create a Boat Definition
- Adding one or more Boat Config Items
- Picking the Config Item Type to add to the Boat Definition
- Giving a Value to the Selected Boat Config Item
- If you have them upload a set of base Polar data from a Velocity Prediction Programme.
Creating a Boat Definition
On the Session List Screen is a button to Manage Boats. Click the button to Open the Manage Boats screen. This screen is available in both the Desktop and Server version of Rockit. As with some of the other steps in this manual it may be easier to setup the initial Boat Configuration in the comfort of your office.
- On the Session List screen press the Manage Boats button to open the Boat List Screen.
- Rockit is designed to allow you to hold multiple Boat definitions. Either different configurations for one boat, double handed versus fully crewed, or just different boats.
- Use the New Boat button to create a new Boat Record.
- This will create a new Blank Boat Record.
- Give the Boat a name and a Type. The example on the right is a J109 called Jengu.
- Save the newly created record.
It should appear on the list at the top of the screen.
You can switch between boats by clicking on boat records in the list at the top of the screen.
If you already have a boat setup and you want to use this as the basis of a new boat. For instance; if you are making minor changes year to year, you can use the Clone Boat Option. That will give you the option to not just copy the boat record itself but the configuration and the polar data thats been collected. The polars will be used to create a set of VPP Polars for the boat; so you will have an initial performance profile for you cloned boat. That is useful if for instance you have changed the sail plan from year to year and you want to find out if the boat is actually going faster. The boat performance will effectively be measured against a combination of the new years data and that carried over from the previous year.
Part One : Creating A Boat Configuration
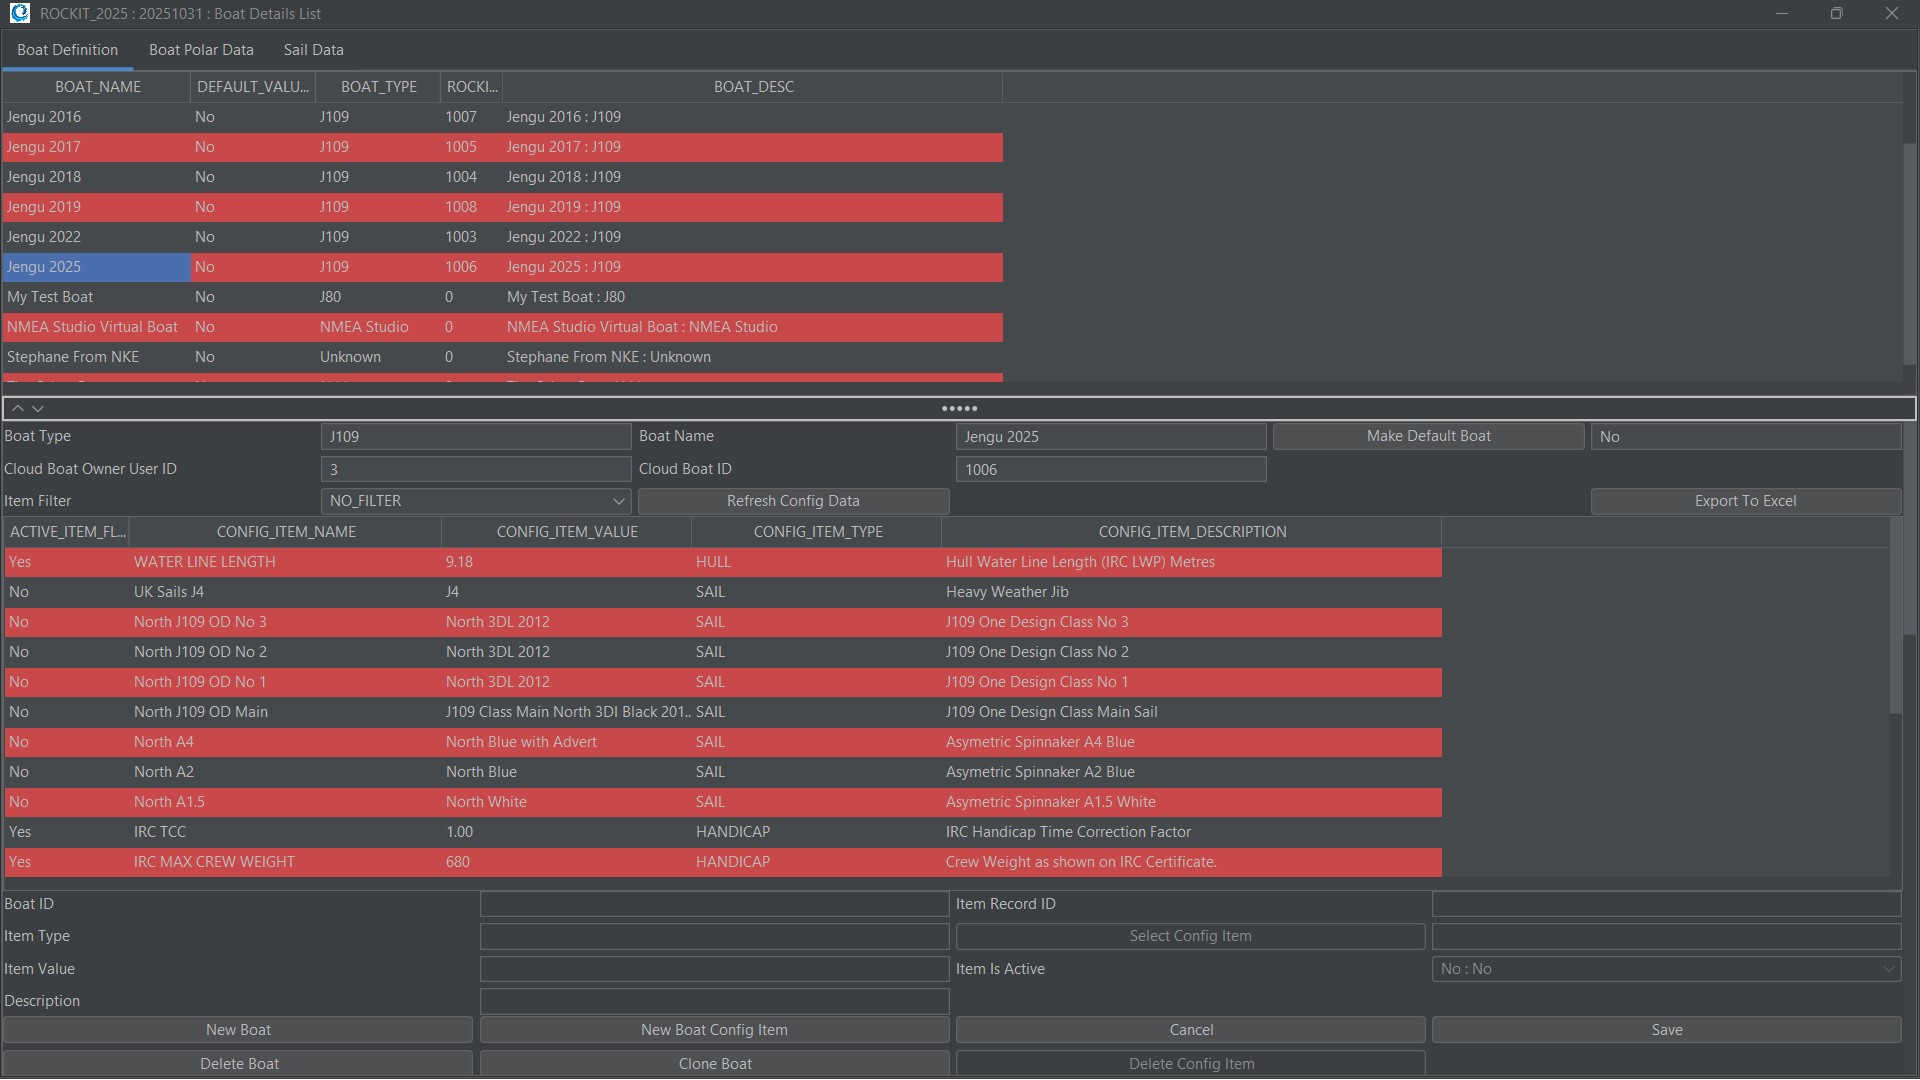
Once you have created a boat record you can start adding configuration information to the record. Configuration is added in the bottom half of the screen.
To create a new Boat Config record;
- Press the New Boat Config Item button.
- This will create an empty record with the most important fields pre-populated with a set of defaults. The fields marked DEFAULT get their values set when you pick a Config Item in the next step.
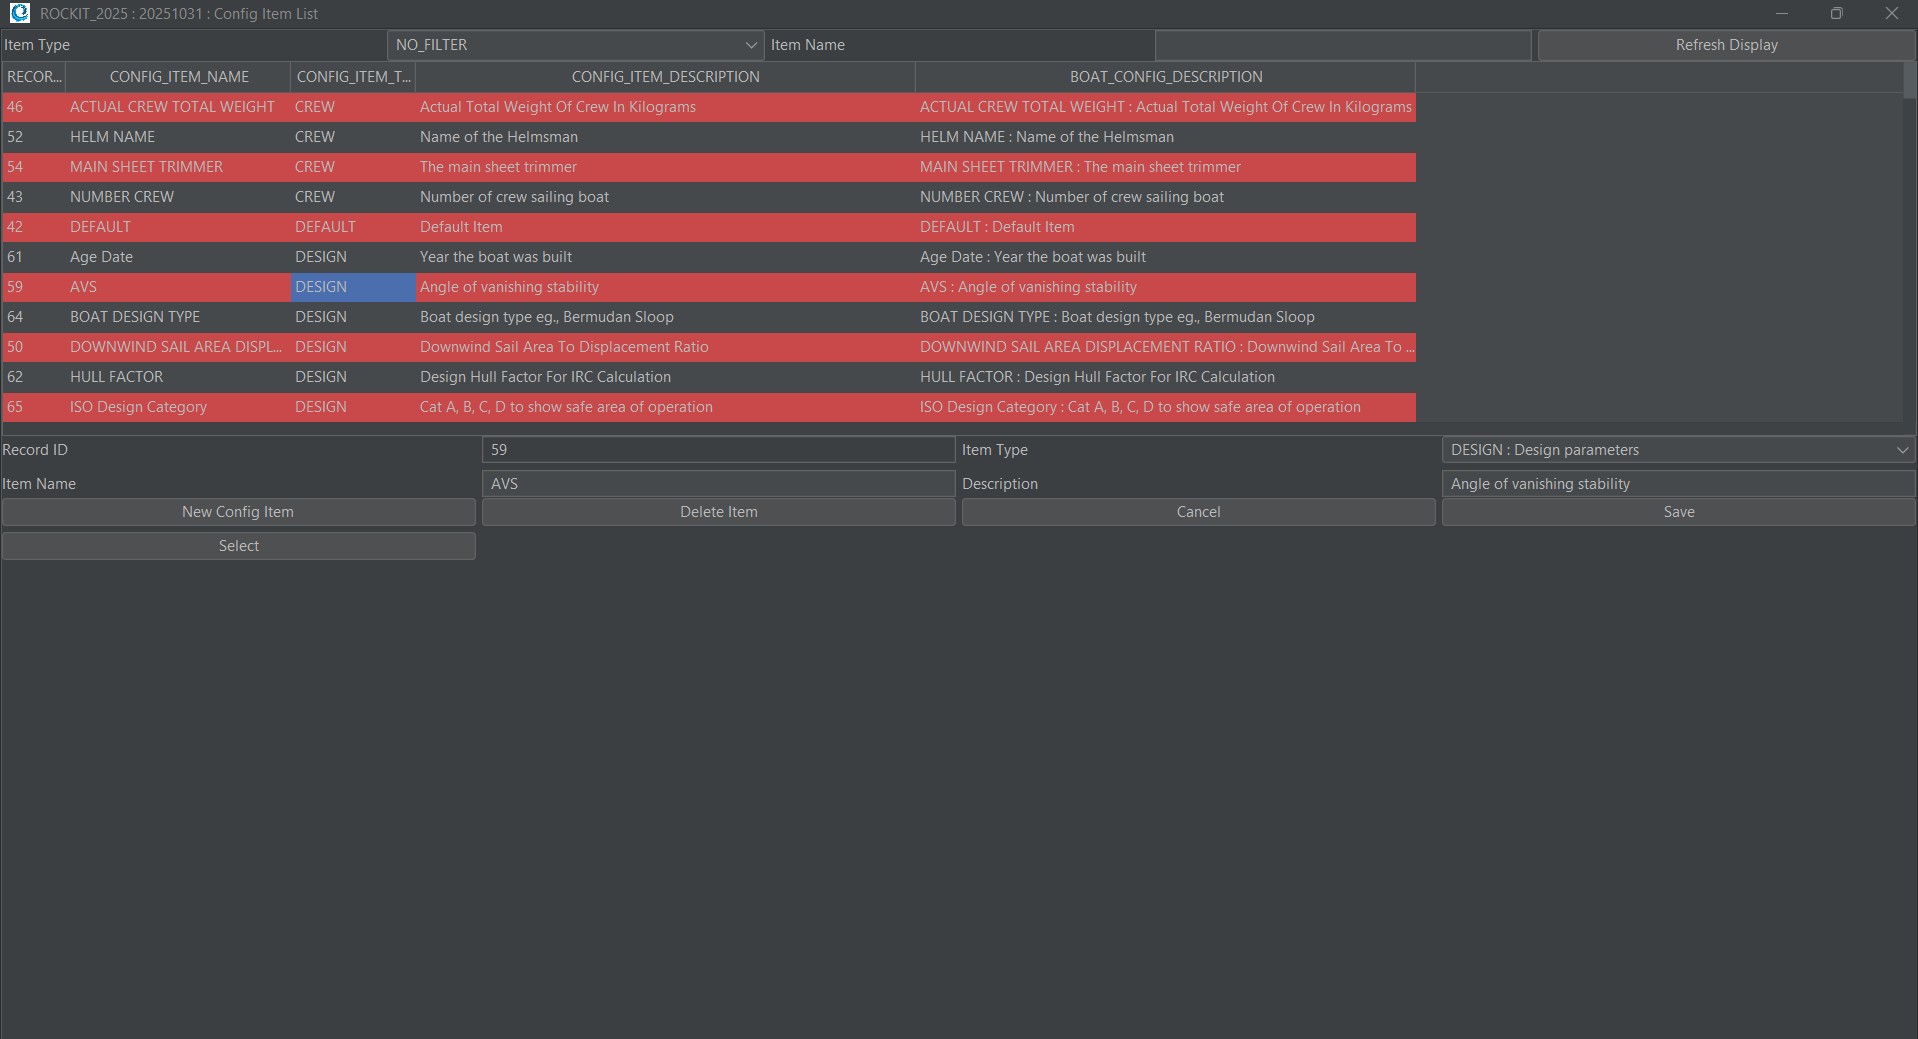
- Press the Select Config Item button to bring up the list of available Boat Config Items. Rockit comes with a list of preconfigured items. But you can also create your own if you need to using the Config Item List screen.
- Scroll down the list of Config Items in the list until you reach the item that you are looking for. You can also filter the items in the list by Type. Click the Type drop list to select the Type you are interested in then press the Refresh Display button to filter the list. So Click ‘Sails’ and press refresh list to display only the possible sails Config Items.
- Clicking on the row in the table that contains the item you are looking for will select the record into the form on the bottom half of the screen.
- This should enable the ‘Select’ button. If this is the Config Item you want to copy the data back to the Config Item record we created on the previous screen. If you can’t find the item type you are looking for Press the ‘New Config Item’ button to create a new record. Give the Item a Name and Description and pick the Type from the drop list.
- Press save to write the information to the Rockit database.
As described earlier you should be able to Select the newly created item to copy it back to the Boat List Config Item form.
Giving a Value to the Selected Boat Config Item
So now we have picked the Item we want to add to the configuration we can give the Config Item Type a value. We picked Boat Weight as our example. Give the Boat Weight a value of 7000. 7000 kg’s as that the unit type specified for the Boat Weight config item. We can also select whether the item type is going to be active as a default for the Boat. We can also turn Config Items on or off as part of the Data Collection process once the recording session has started. Generally Sails are set to be inactive and turn active during the recording session.
So our Config Item has a Type and a Value. We can use the Save button to save the changes we have made. The Boat Config Item should appear in the List of Boat Config Items on the Boat Screen next to the boat we have created.
Summary
We can repeat this process to build out a full description of our boat. As with a lot of the set processes its easier to do these steps on dry land before you go afloat. All these functions are accessible from the Rockit Desktop Analytics application. Its important to focus on which Config Items you set to be active and which ones are left inactive.
The User Guide section that describes the Rockit Session Data Screens will show you how to make a Config Item active or inactive mid way through a recording session. This is particularly useful where you are changing sails mid race. You want to record performance data against the sails that are active and in use. A sail change will necessitate making one sail active and another inactive.
Polar Data Collection and Review
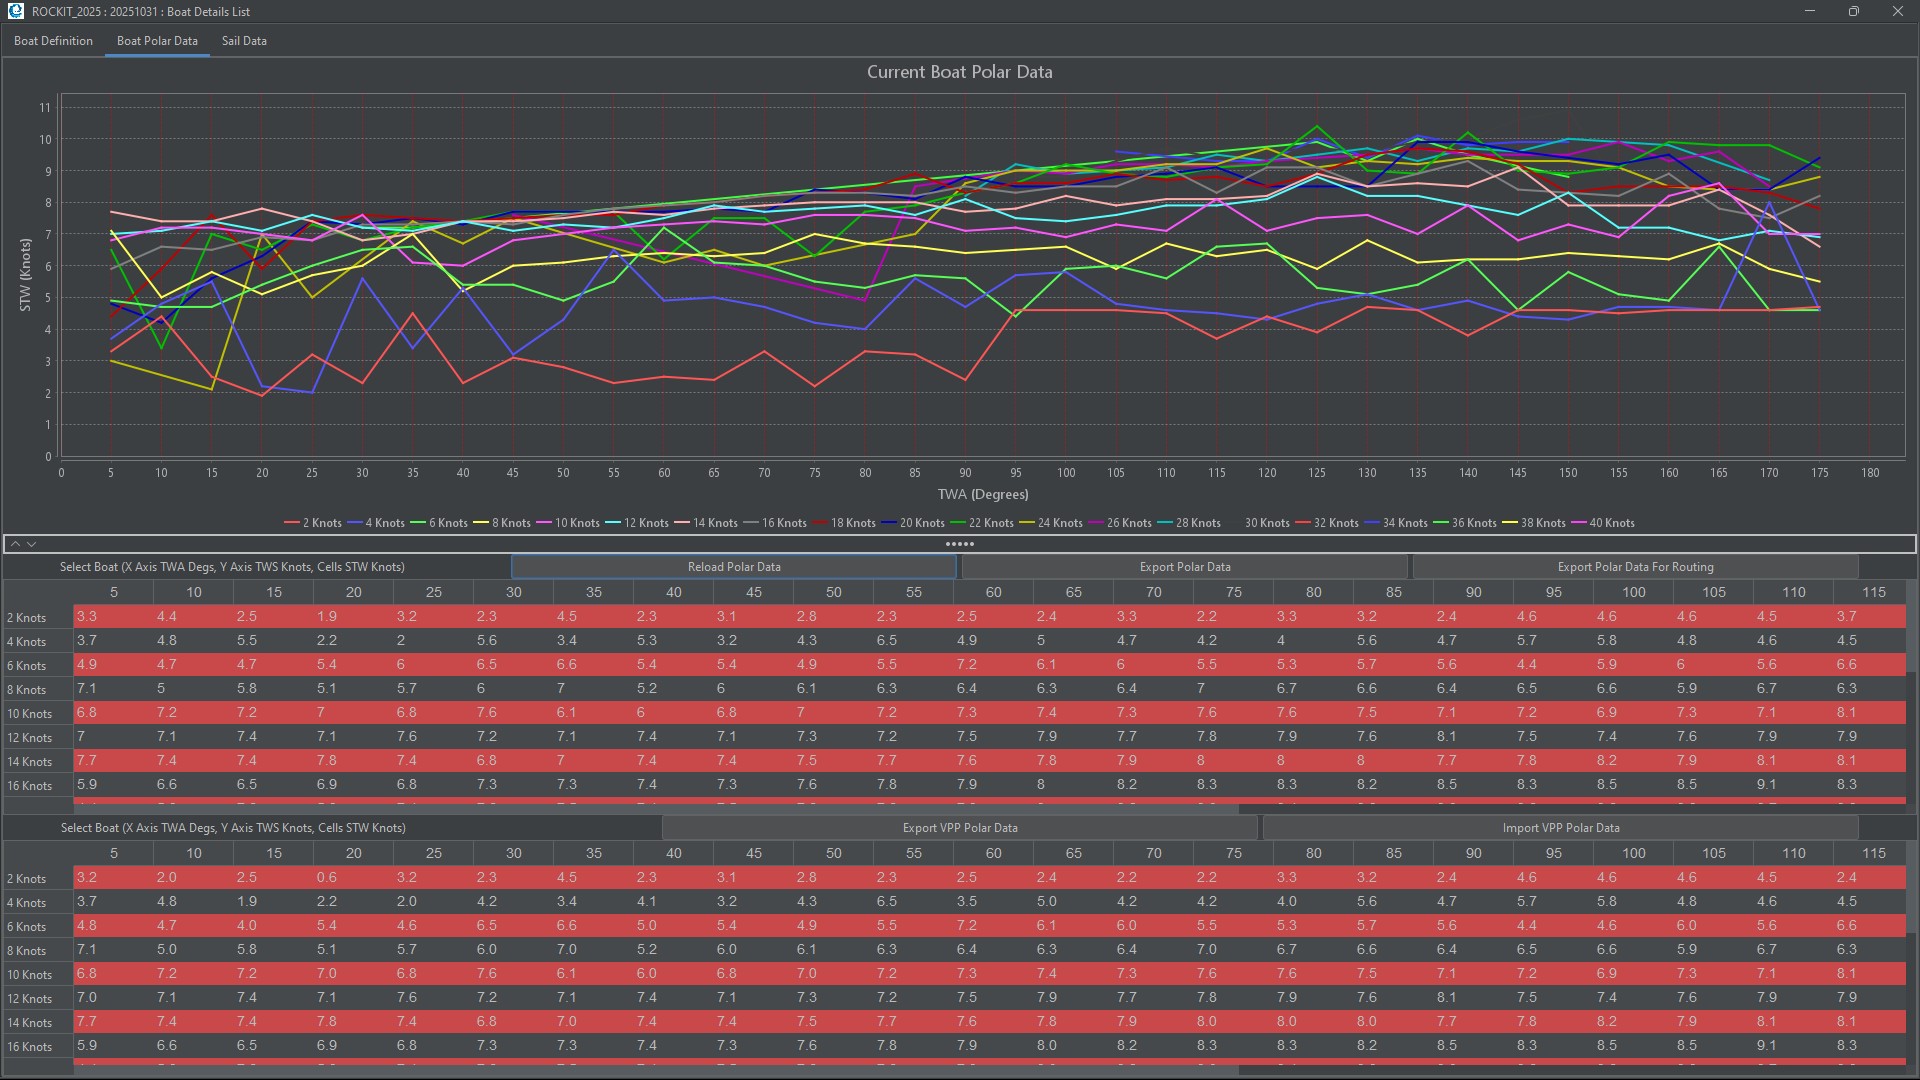
The Polar Data tab on the Boat List Screen displays three sets of data
- A line graph for the Polar Data for all sessions plus the VPP Polars.
- A table of Polar Data for all sessions plus the VPP Polars
- An editable table of the VPP Polars
Setting Up To Collect Polar Data
Rockit contains Polar Data at 3 Levels.
- Polar Data From Velocity Prediction Programmes that has been uploaded to the Rockit Database.
- Polar Data at the Boat level that has been calculated based on boat performance during recording sessions.
- Polar Data at the Session level for a boat that has been calculated based on boat performance. We talk about this more in the section on collecting data.
Adding Velocity Prediction Programme Data To The Boat Polar Definitions.
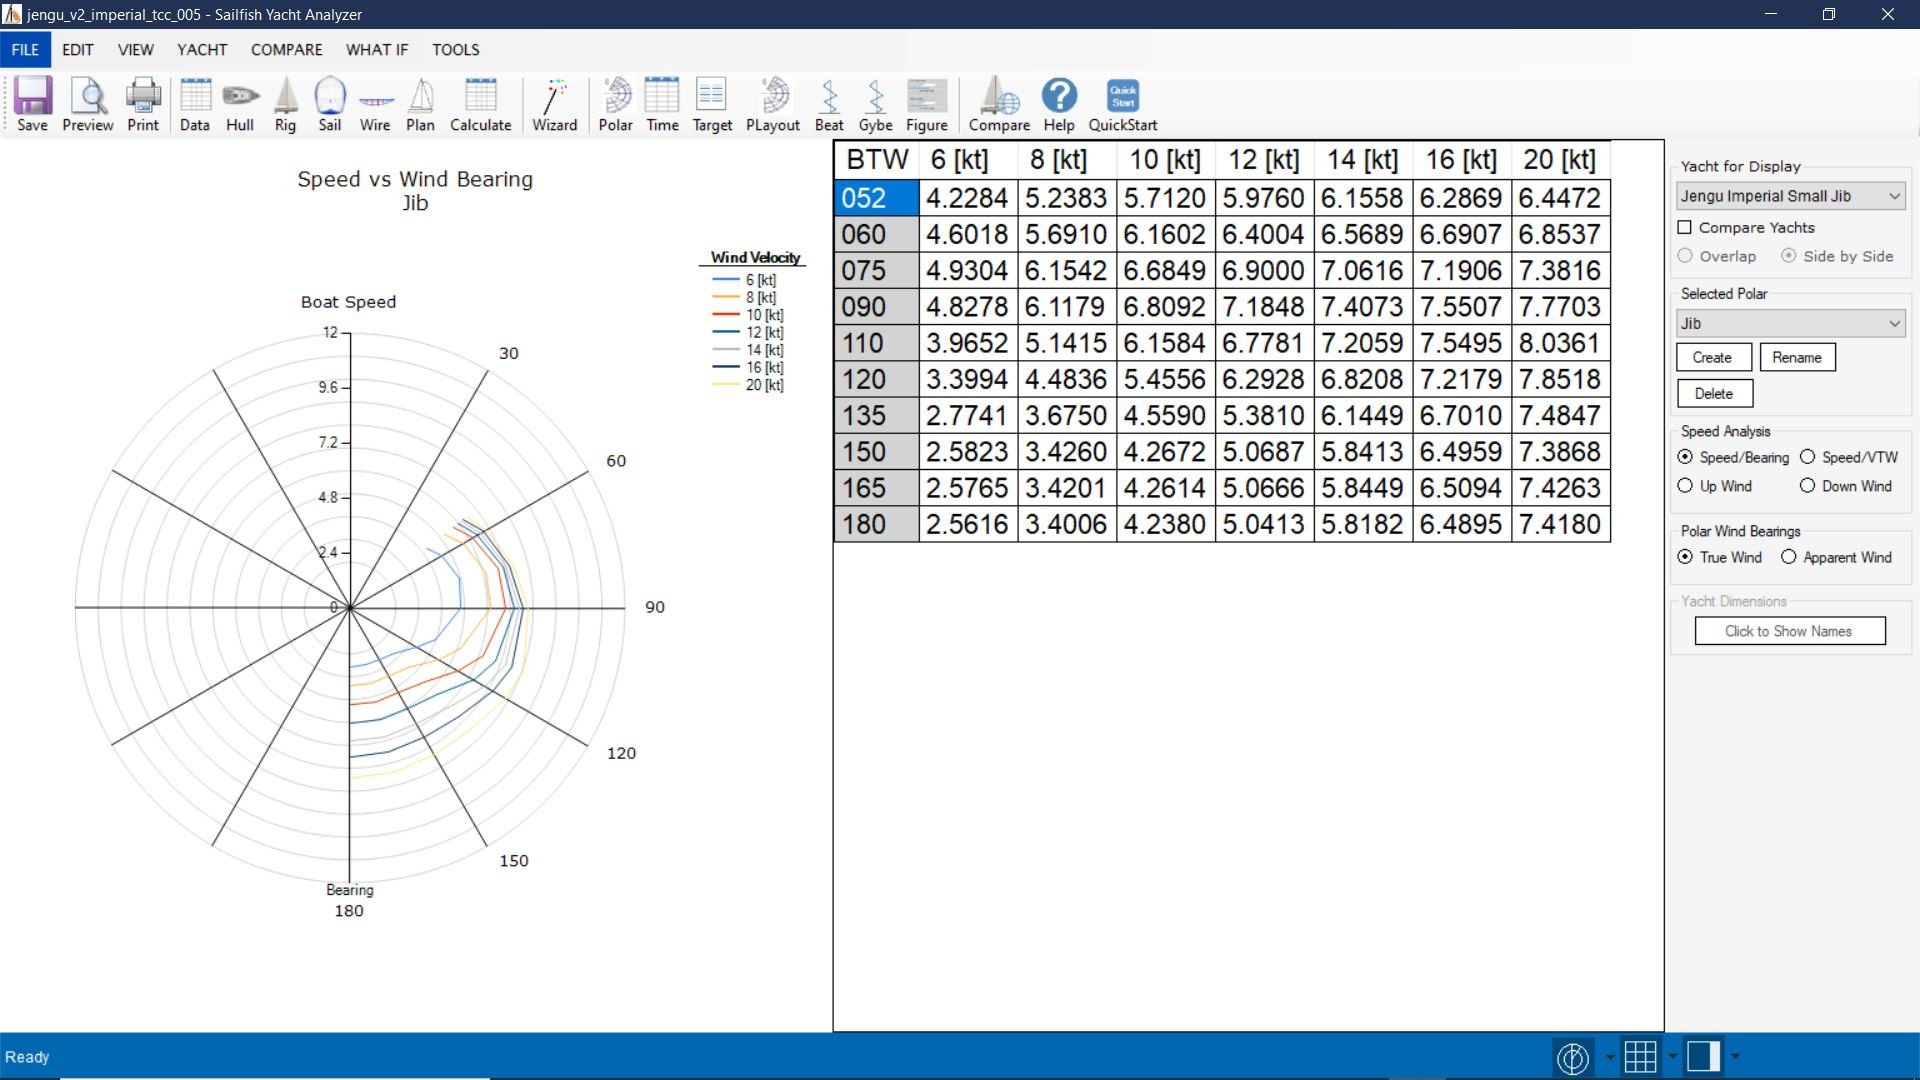
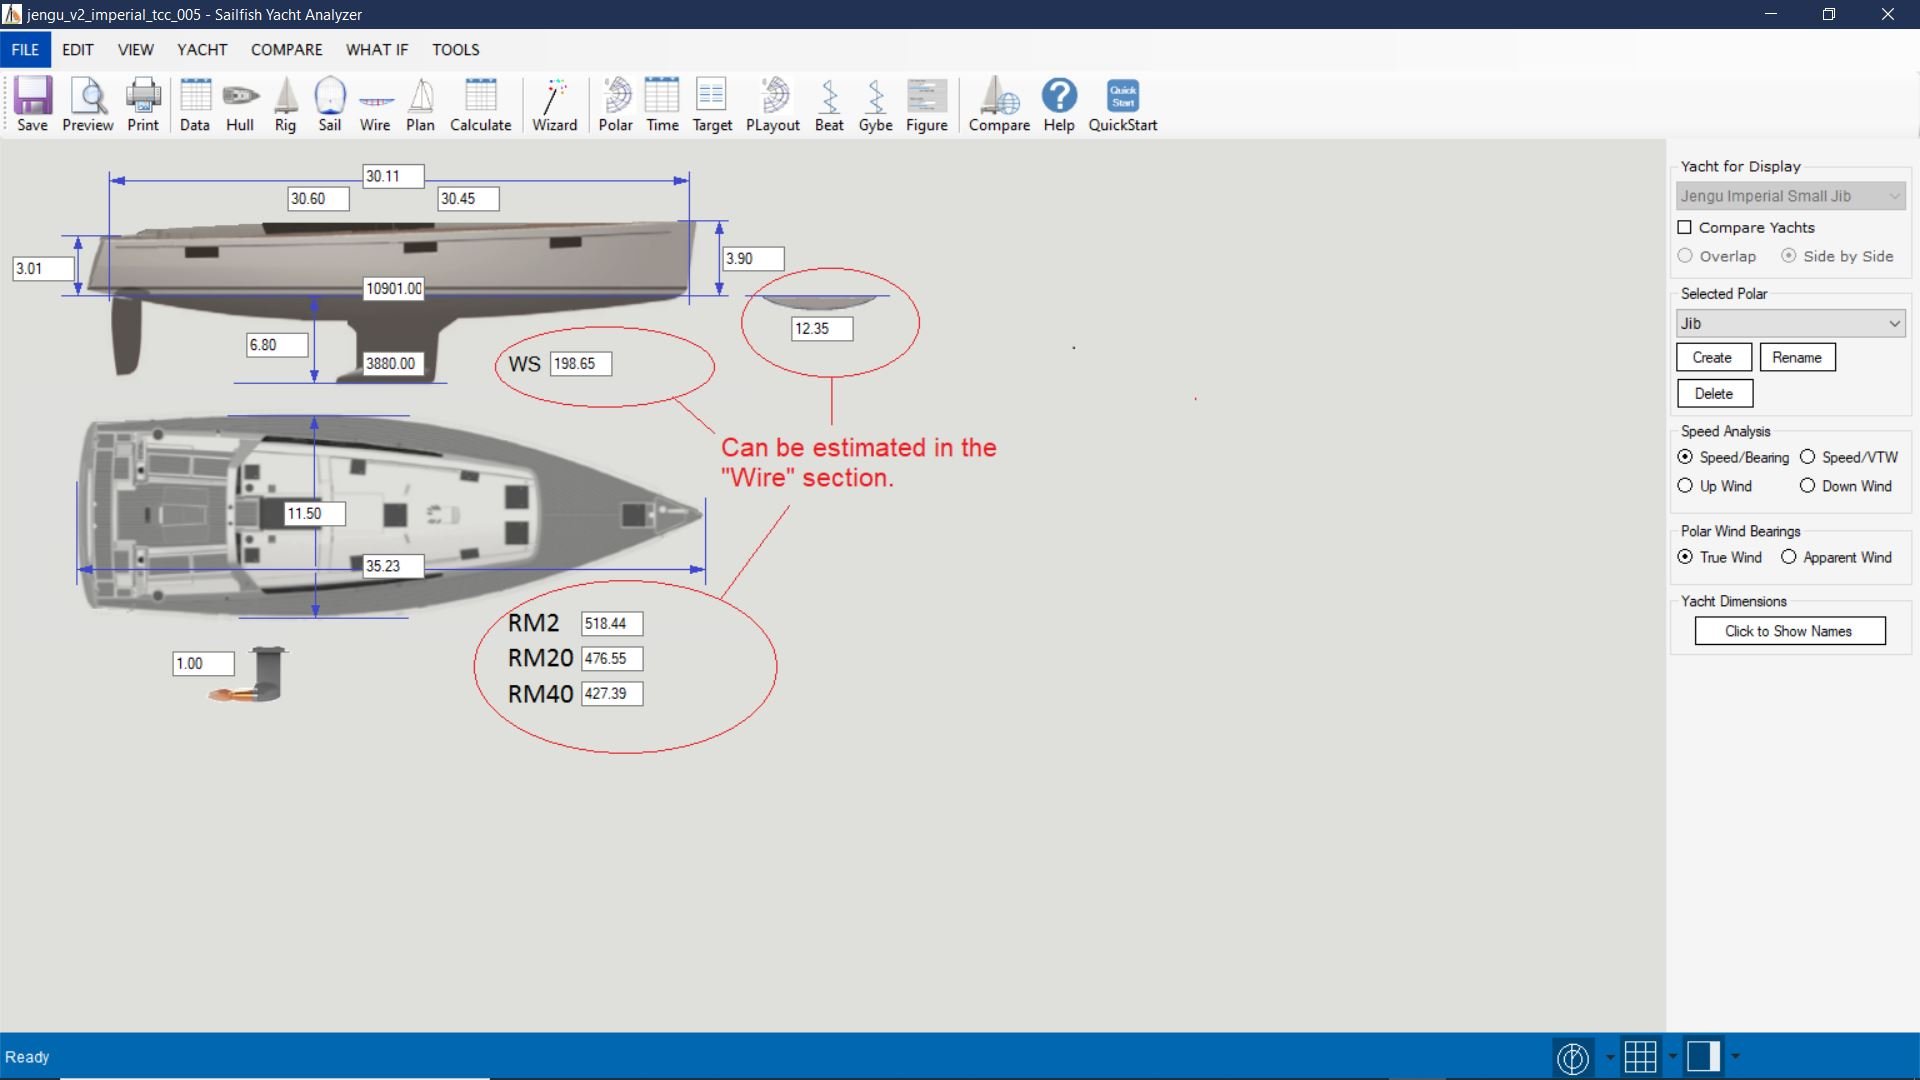
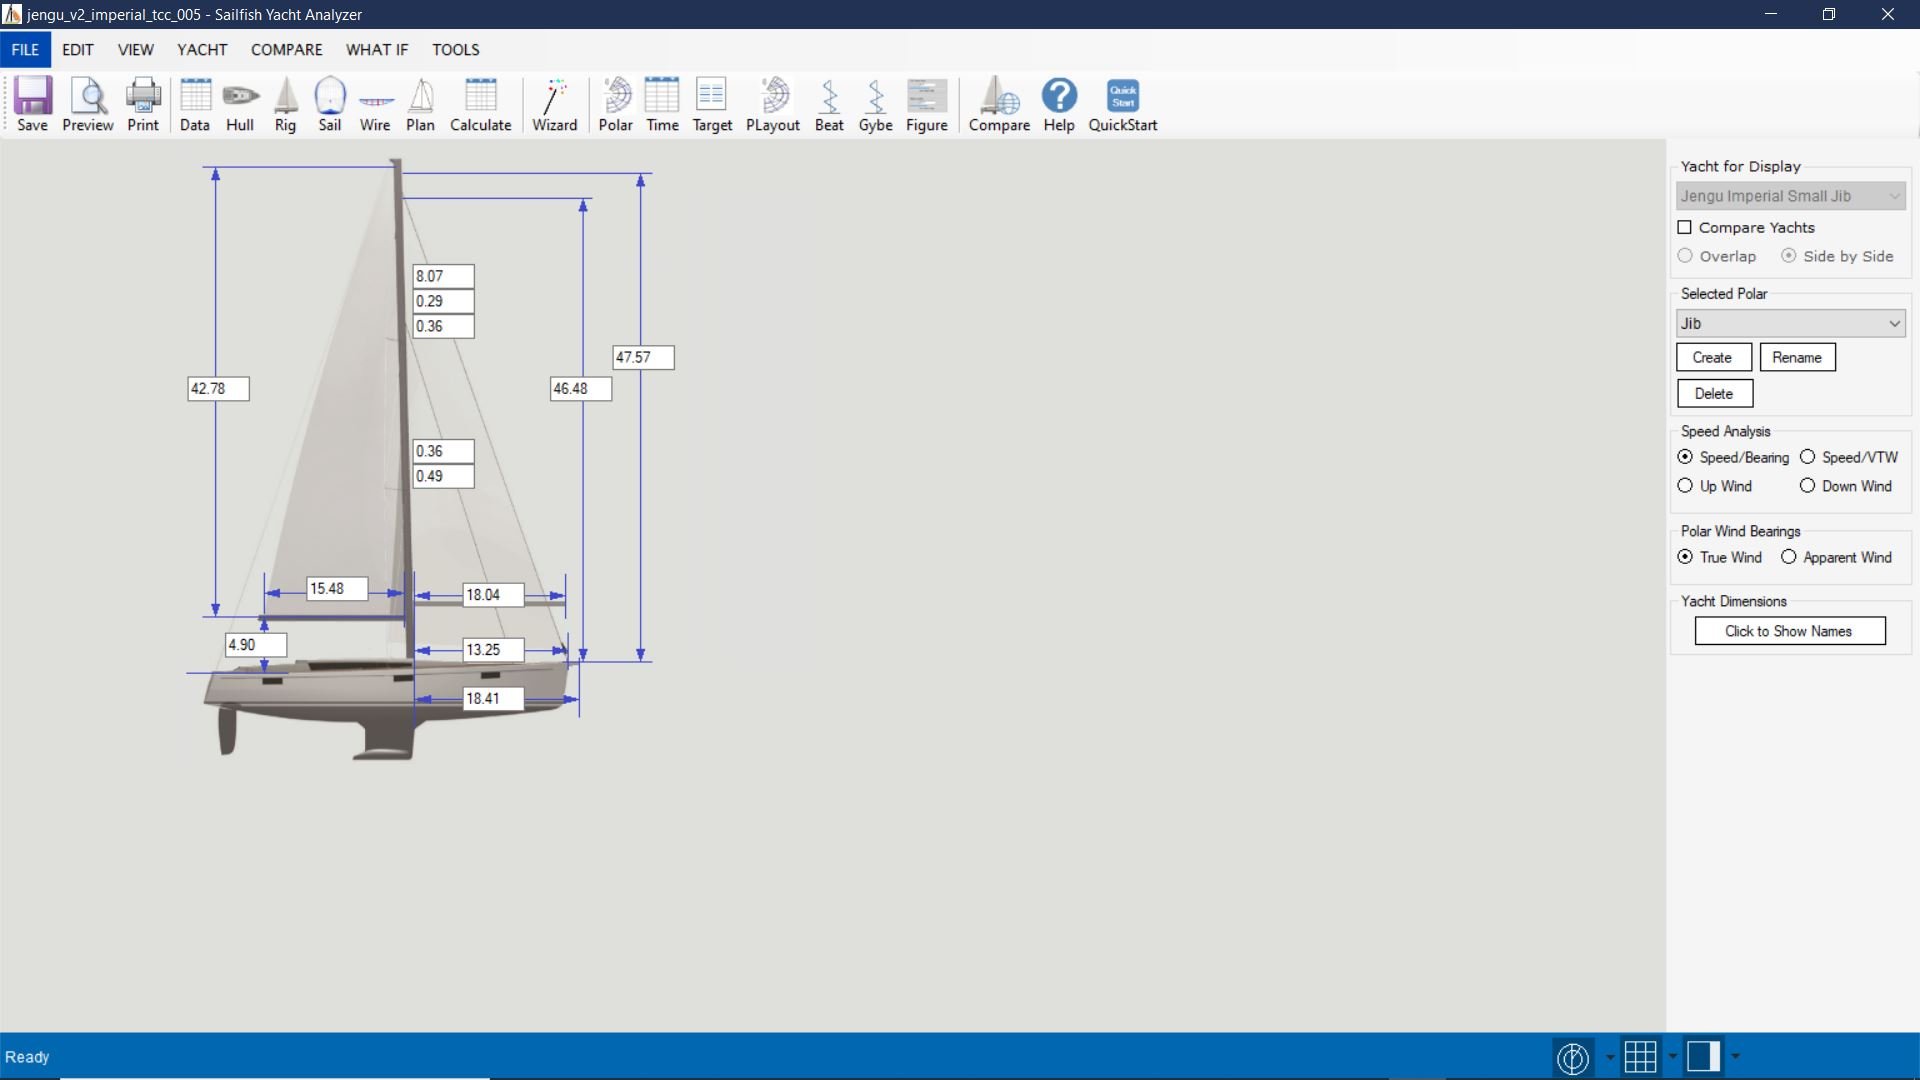
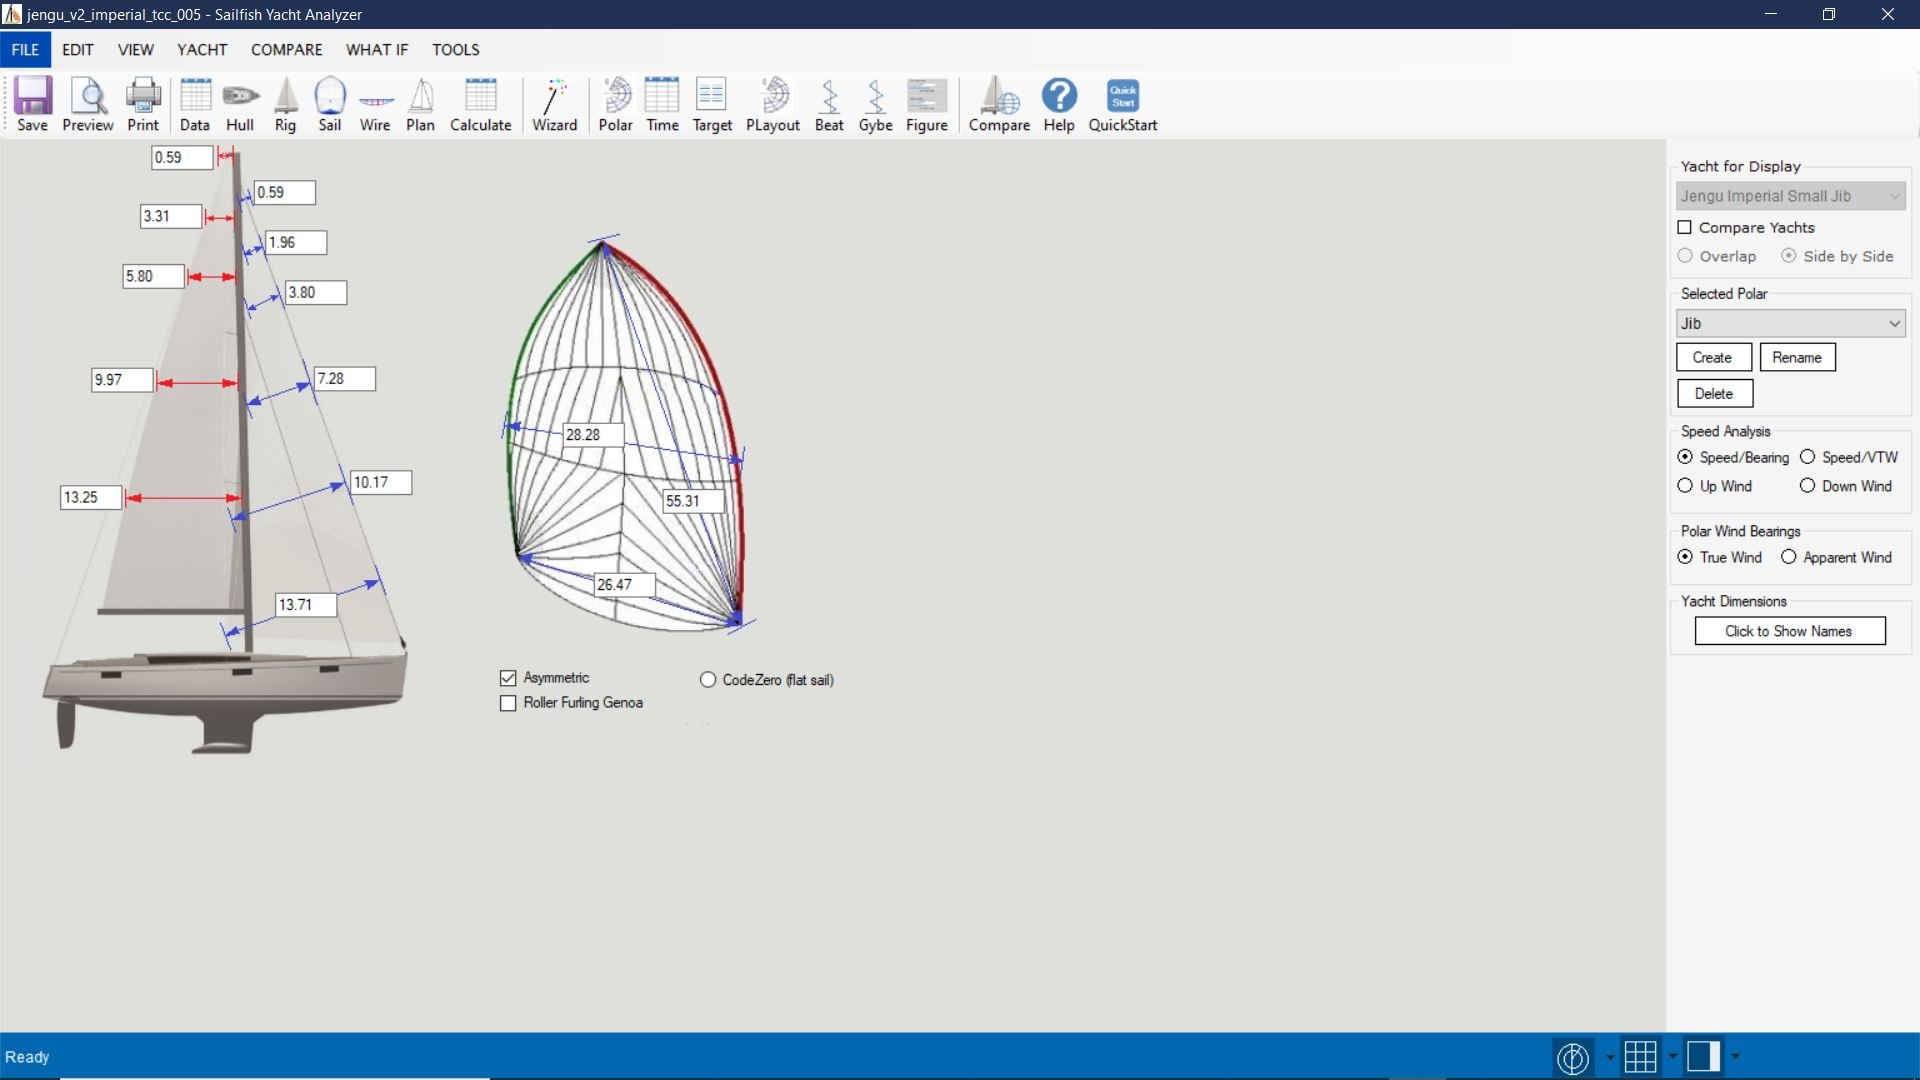
We use a Velocity Prediction Programme called Sailfish to calculate a base set of Polar Data for the Boat. Sailfish will compute basic Upwind and downwind boat speeds for different wind speeds/angles. That gives us a base set of data to use as an initial performance envelope. Its a theoretical number. We have to do a certain amount of work with a spreadsheet to prepare the numbers Sailfish produces for import into Rockit.
Rockit wants a single set of figures which represent the wind angle range from 0-180 away from the wind as a single sail. Sailfish produces 0-180 figures for headsail and downwind sail separately. To produce the data for Rockit you need to pick the highest numbers. So the headsail might be quickest in the 0-60 True wind Angle Range, the Spinnaker prediction better in the 60-180 range; though at lower wind speeds that may not always be the case. We can then overlay the performance from the real world over that set of VPP Polars.
Rockit uses Polar data to produce target boat speeds and to colour the tracks displayed as part of the Session Data Display. The target will be the higher of the VPP Polar and the recorded real world figure. We find that the real world figure is generally higher than the VPP when the crew is up to speed so eventually all the Polars and Targets will be based on actuals rather than theoretical numbers.
Importing VPP Data from CSV
When you initially create a boat it gets a default set of 0 values VPP data created.
![]()
You can export that data to create a csv file that you can then edit and reimport into the Rockit Boat VPP panel.
The import steps are as follows;
- Export the existing VPP data from the Boat Polar tab for the boat you want to update.
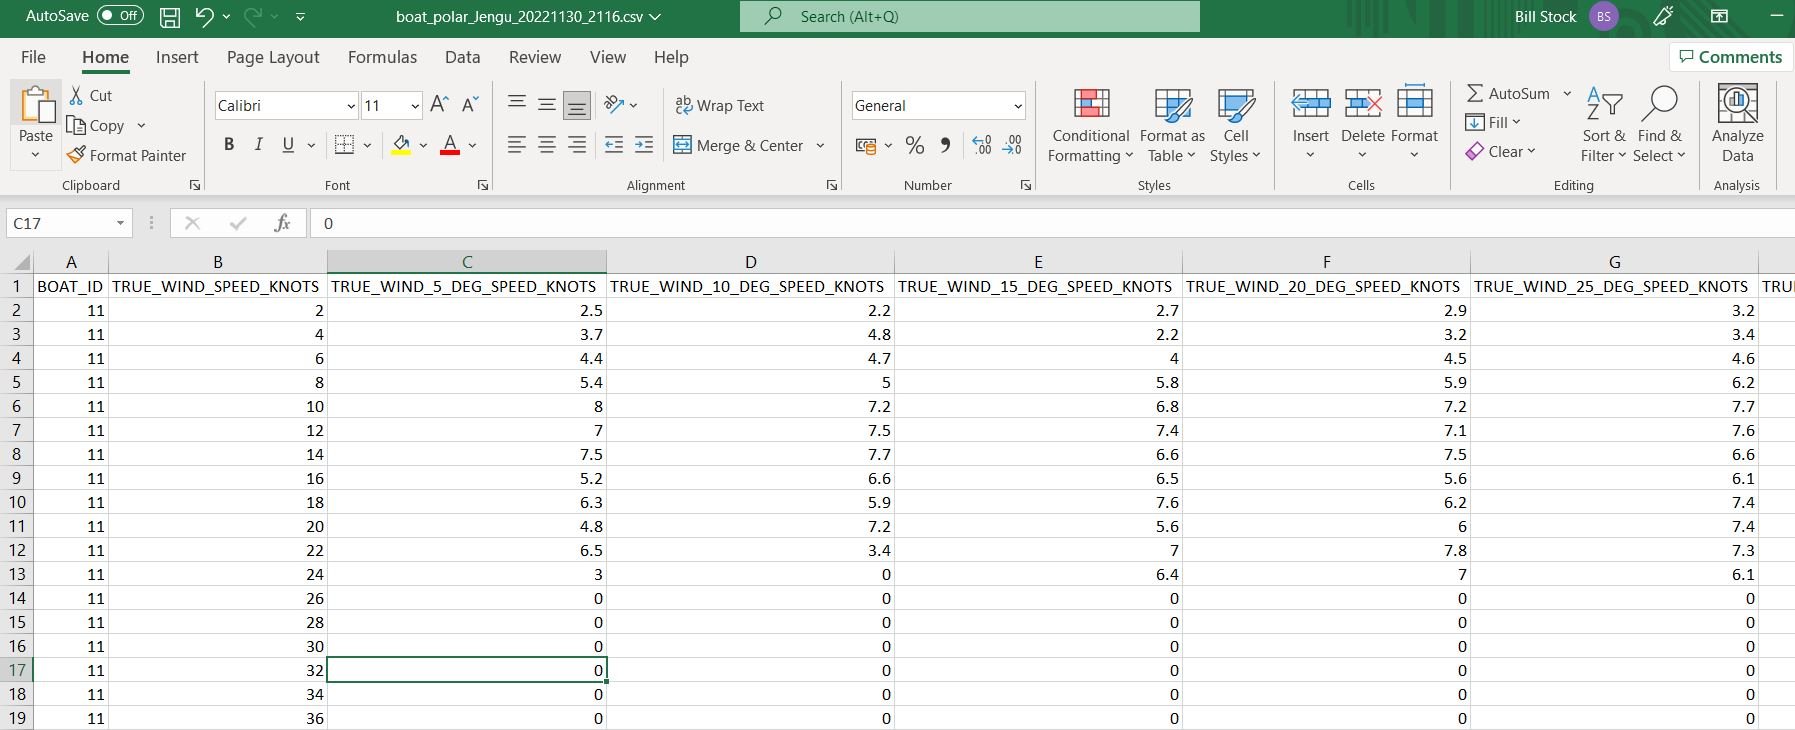
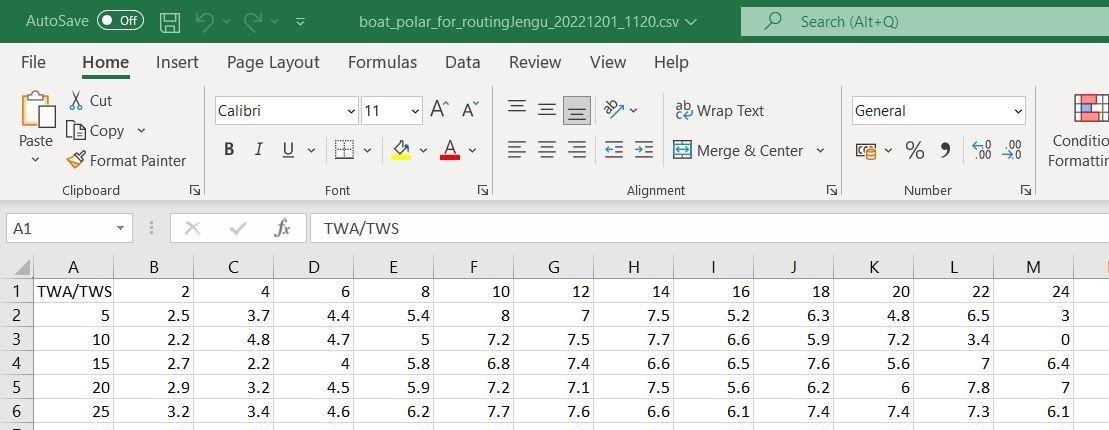
- Open the exported csv file in a tool like Excel.
- Edit the values you want to change. You are editing the values for the wind angle wind speed combination. Do not change the values in the Record ID, Session ID, Boat ID or Polar Type columns. Rockit need those as they are to map them back to the Boat records on the import. This process is actually updating existing records rather than importing new ones.
- Click the Import VPP Button to open the import screen.
- Select the csv file you have been working on using the Open File button at the top of the screen.
- Press the Load File Data For Preview at the bottom of the screen. That should load the data you have been editing into the top half of the screen.
- Press the Save Data To Database button at the bottom of the screen. That will load the data into the database. You will see diagnostic messages appear in the bottom half of the screen.
- Use the Cancel button to close the Import Window.
Your updated VPP data should now be set against the boat.
If you don’t want to go the import export route for the VPP info you can just edit the individual values on the Boat VPP panel. Double click in the cell to make it editable, enter your value then click elsewhere on the screen to complete the update.
Once you have finished editing or loading your VPP data click the Reload Polar Data button below the graph panel; your changes will now appear on the graph; assuming the VPP value is greater than ay existing Session based Polar Data.
Exporting Polar Data for Import into other programmes.
We have created two options to extract Polar data for load into other programmes.
- Extract as a simple CSV file. This exports the information as it appears on the screen with each row representing a Windspeed band and the columns being the data for the True Wind Angles.
- Extract as a file that can be loaded into a Routing Programme. This exports the data with True Wind Angle as the first column in the Row and the Wind Speed as the Column Header.
The .csv files can easily be reviewed in Excel.
Once exported the data can be loaded into software programmes such as OpenCPN, PredictWind and Adrena.
Generating And Reviewing Sail Cross Over Data
The final tab on the Boat screen displays sail data. We touched a little bit on the sail performance charts on the Reviewing Data section of this User Guide. That section talks about looking at the data for the sails at the boat level. so we see all of the data we hold for a given sail or sails.
Follow the steps below to review.
- On the Session List Panel click the Manage Boats button.
- Select the boat that you want to review Sail Data for.
- Select the Sail Data tab.
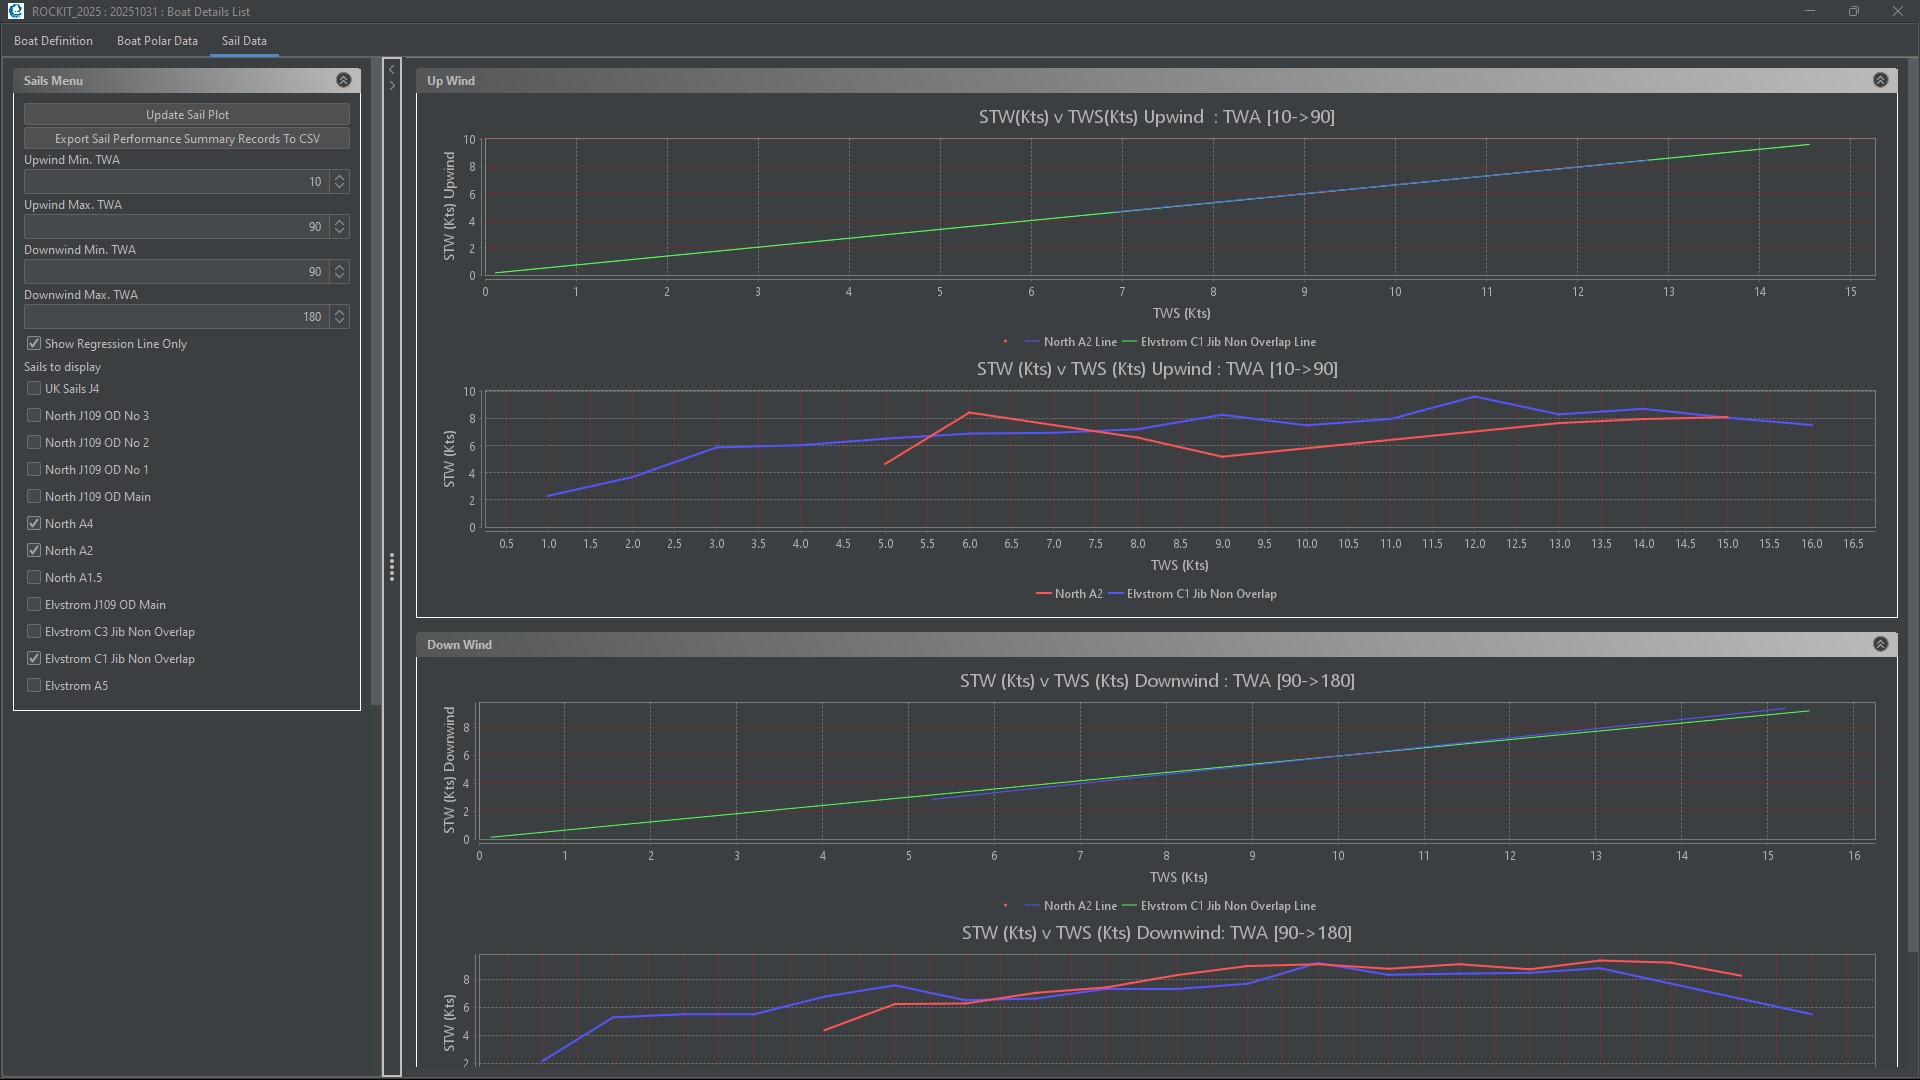
This will bring up a screen like the one on the right,
The list of sails displayed will match those in the Boats configuration. Its worth noting that just because there is a entry in the check list for a sail doesn’t mean any data will be available to display. This panel is pulling the data from all the sessions that have been recorded against this boat definition. Rockit won’t estimate any missing data points so the regression lines may not go the whole way across the graph.
The sails to be plotted are selected by checking the check box in the list on the left.
Rockit looks at the boat speed through the water in the timeslots where the wind speed and wind angle match.
Rockit will plot the collected data in 4 graphs.
- A regression line for sails data points between 10 and 90 degrees to the true wind angle. This default view will pick up all up wind data and plot the regression line based on the wind angle and wind speed.
- A plot of the average boat speed for the given wind angle range between 10 and 90 degrees true is the default effectively upwind. This view finds all the timeslot records where the TWA and TWS are within the required range and averages out the results. The resulting averages are then plotted.
- A regression line for sails data points between 90 and 180 degrees to the true wind angle. This default view will pick up all down wind data and plot the regression line based on the wind angle and wind speed.
- A plot of the average boat speed for the given wind angle range between 90 and 180 degrees true is the default effectively down wind. This view finds all the timeslot records where the TWA and TWS are within the required range and averages out the results. The resulting averages are then plotted.
We can start to see some of the patterns in the data.
- The North A4 has never been used – or at least we don’t have any data. If we think there should be we can use the bulk edit functionality on the Recording Session Data Display screen to correct that.
- Not surprisingly the Elvstrom C1 Jib is faster than the North A2 spinnaker upwind and the reverse downwind. Though this is clearer in the averages plot than in the regression plot. In fact the suggestion from the Regression plot (1st and 3rd graphs) is that the A2 might be faster than the C1 in very light winds upwind and the reverse downwind.
Which seems unlikely ……
Displaying The Actual Data Points For A Sail Data Plot
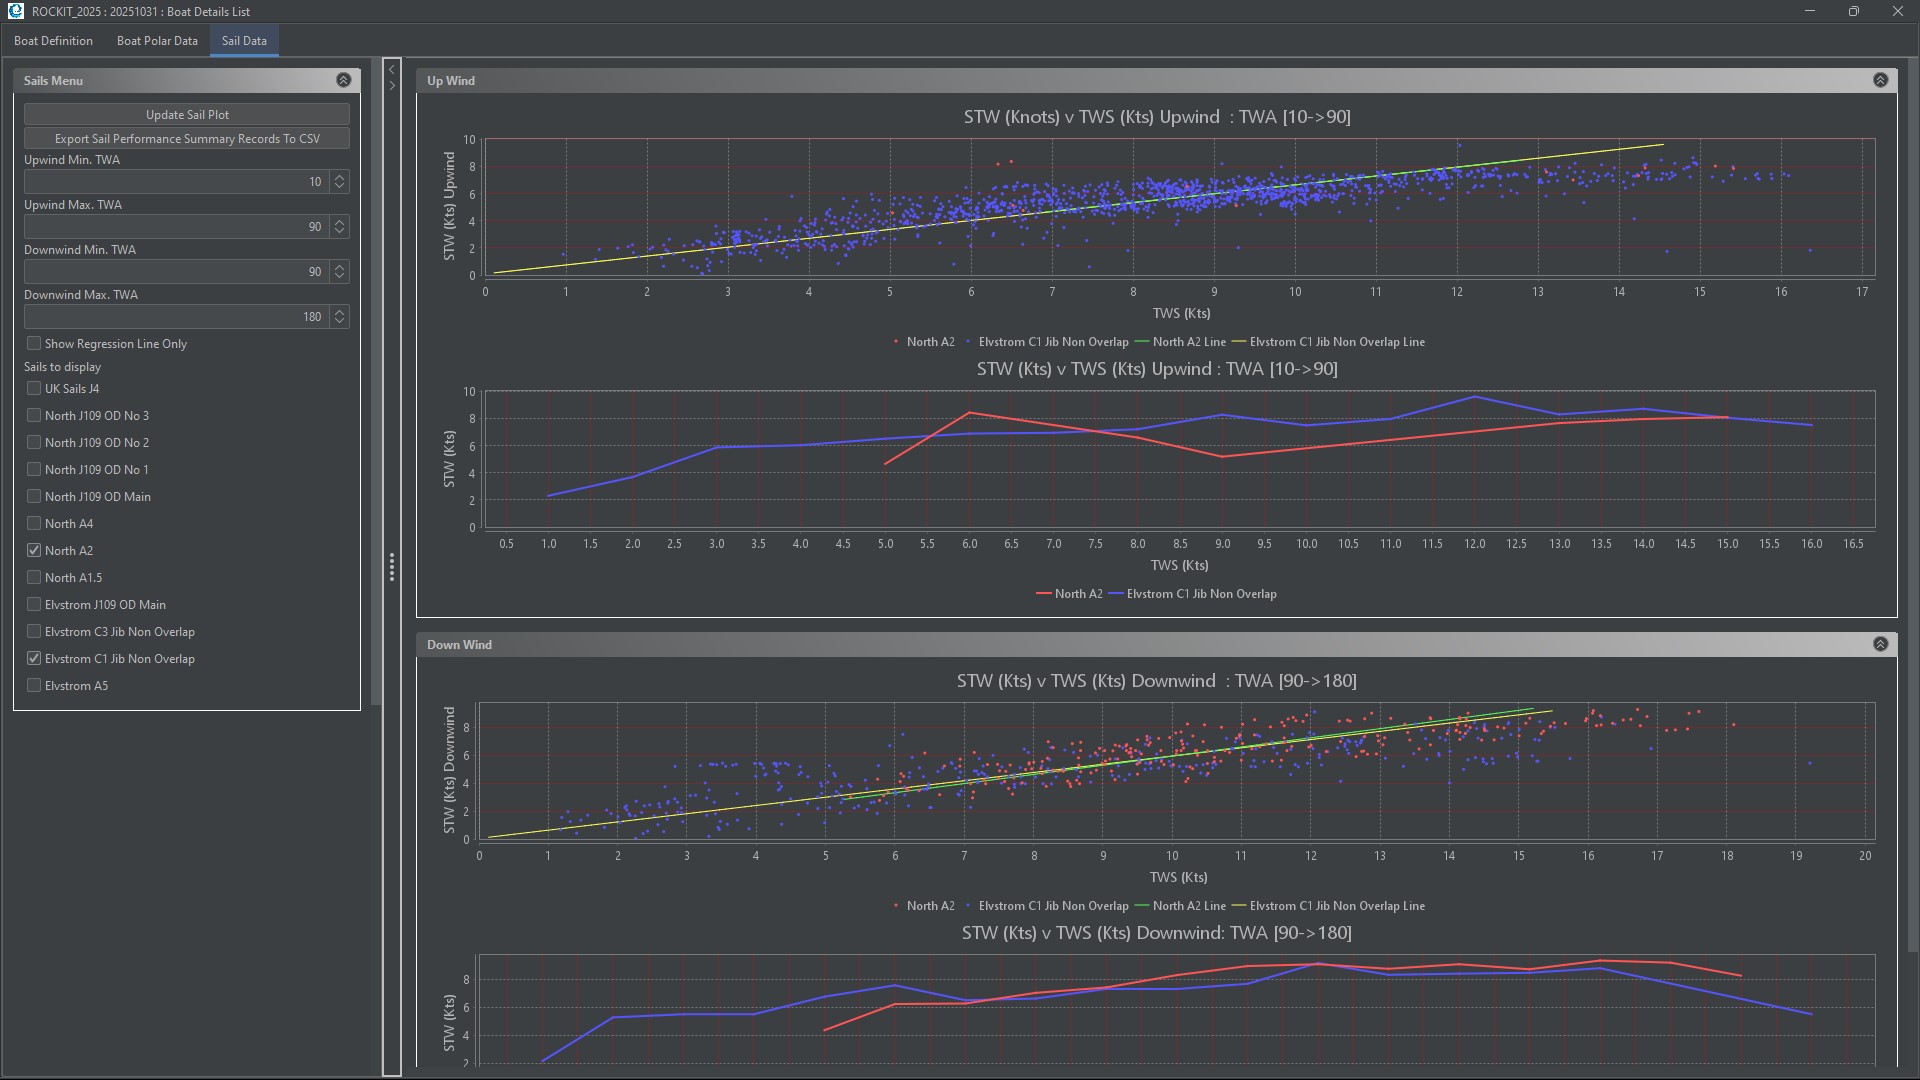
If we uncheck the Show Regression Line Only check box and press Update Sail Plot Rockit will produce the graphs above. It overlays the data points it used to calculate the regression lines onto the plot.
In the example this shows us a couple of things.
On the top graph we have a lot of blue points (C1 Jib) and hardly any red ones (A2 Spinnaker) which makes sense if we are looking at an upwind graph. It shows us that the regression lines are being distorted by a couple of outlying values for the A2 spinnaker.
On the 3rd graph we can see the red and green dots are more evening spread. Red is the A2 Blue is the C1. But in the mid section 7 to 15 knots TWS the red dots tend to be associated with a higher boat speed. There are a few outlying blue dots that will have influenced the averages in the lower graph.
But we can say with a fair degree of certainty that the C1 is faster upwind and the A2 downwind.
The question though is at what wind angle do they swap around ?
Plotting Sail Data For A Specific Wind Range

If we want to really understand the performance of the sails we can narrow the wind angle down.
Suppose we know that we are going to be sailing a course that is roughly 90 degrees to the true wind angle at between 7 and 10 knots. Which sail should we pick ?
We can set the Maximum and Minimum wind angles for the two sets of graphs using the fields on the left control panel.
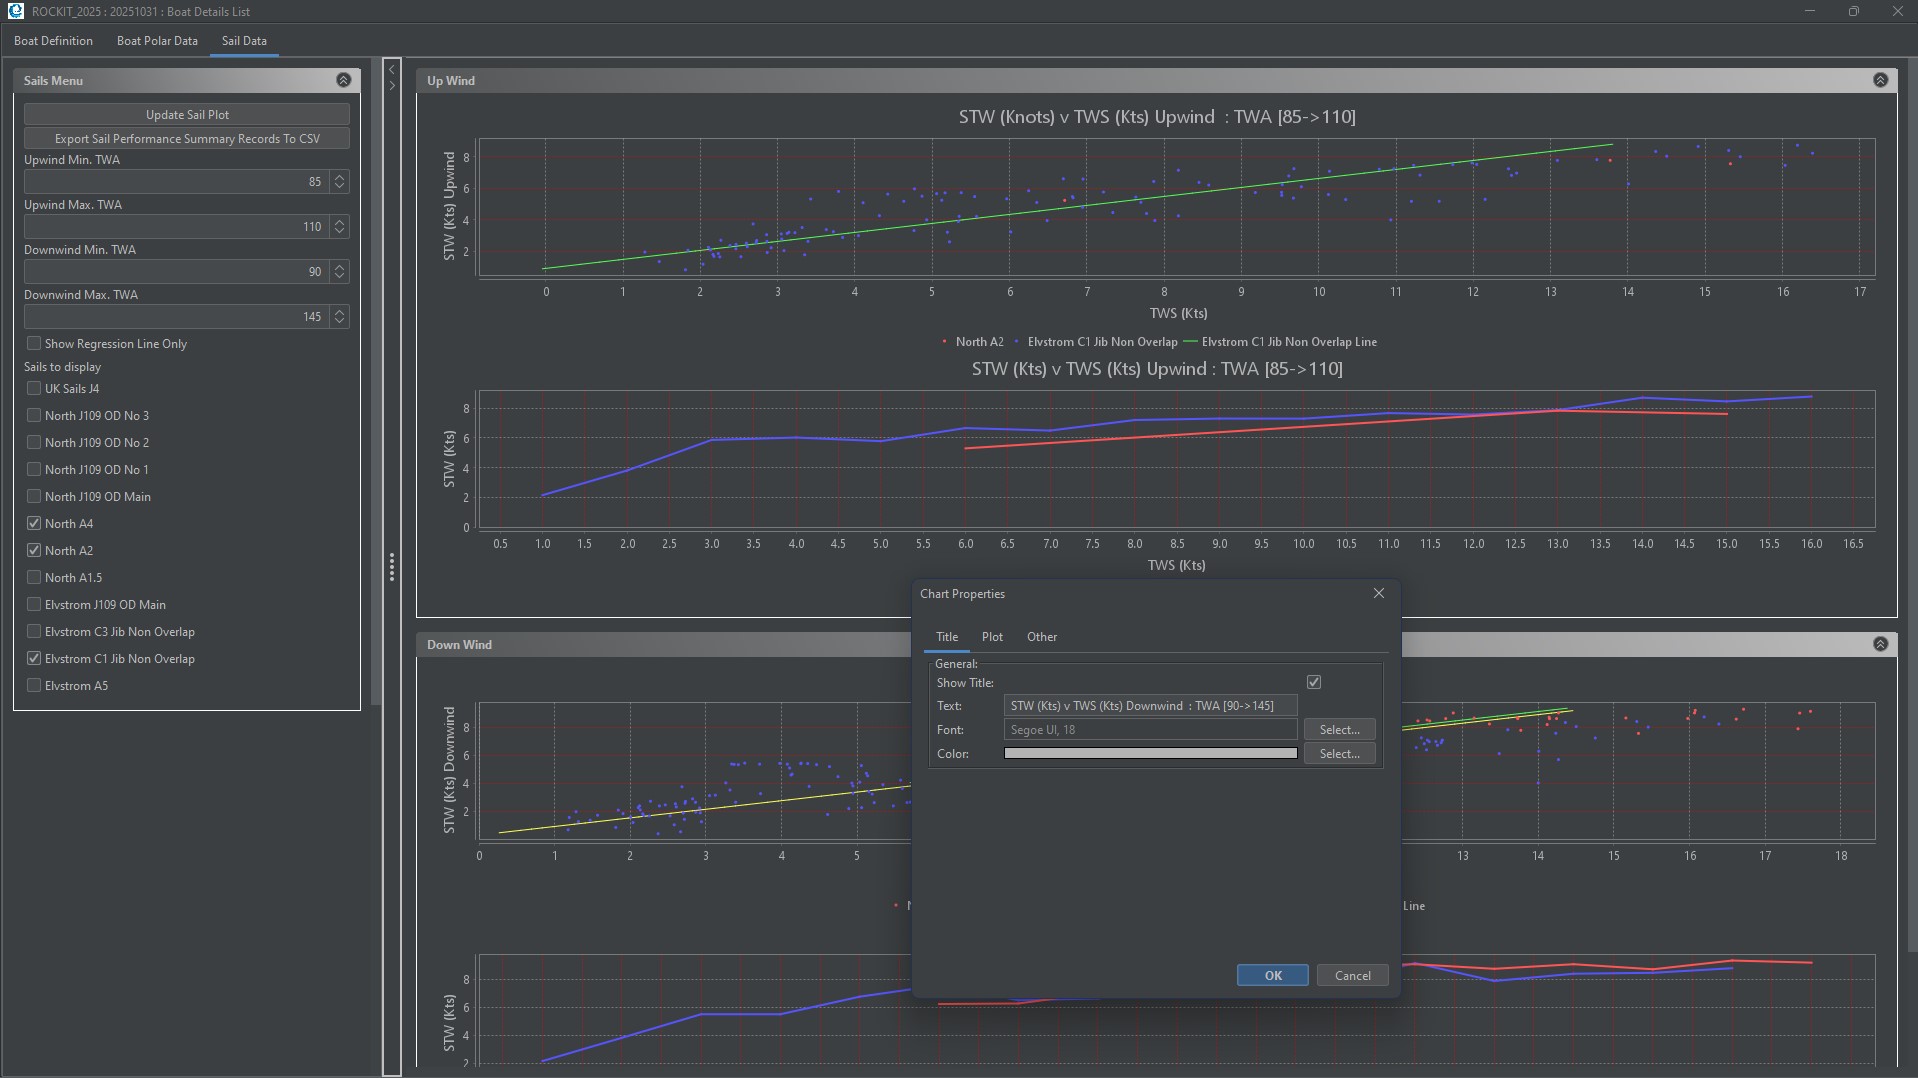
We actually only need to change one pair of data points to answer our question. We set the Upwind Min angle to 85 degrees and the Upwind Max angle to 95 to cover the points around our expected average angle allowing for shifts in the wind of 90 degrees true. Remember this is the true wind angle relative to the boat. Not the True Wind Direction relative to North.
We can then press the Update Sails Plot panel to refresh the graphs.
The result on the right shows that the C1 is probably going to be faster than the A2 – certainly based on the second graph of averages. The Blue Line (c1) on the second graph is above the Red (A2) line.
Which makes sense if you think about it. 10knots wind, 6.5knots boat speed at an True Wind Angle of 90degrees is going to give us an Apparent Wind Angle of about 60degrees with an Apparent Wind Speed of 11-12knots. An A2 is nominally a running spinnaker so the C1 Jib is quicker.
In our data set there are actually relatively few data points for the A2 relatively to the C1 so you could argue its worth a try especially as the regression line suggests that the A2 would be quicker on that wind angle in lighter wind conditions.
It would be interesting to see what figures we would get for a reaching spinnaker like the A1.5 or an A3 or even a Code Zero. We would have to go out and record the data to find out which was quicker but the C1 data gives us a baseline to compare to.
Notes
Printing Graphs.
If you right click on each graph panel you can reconfigure the graph properties and export it to a .png file. Any changes to the properties won’t be saved when the Screen is closed; it will return to the defaults at that point.
Exporting Data
All of the tables are exportable. You will get a message on the screen once the export is complete telling you where the .csv file has been written to.
Keeping Different Configuration Versions for the Same Boat
Boats change and quite often we have different setups depending on whether we are sailing fully crewed or double handed. Rockit allows you to define multiple boats which allows different configurations of the same boat be to be recorded against at different times. You can pick the Boat definition that matches your current profile and start recording against it. This is explained in more detail in the User Guide section that talks about recording data.
Velocity Prediction Programme.
We have used Sailfish Analyser from Techsail. There are other VPP’s out there. We just found that relatively easy to use with a limited level of time and technical know how. Its also very reasonably priced. The team at Techsail have also been happy to answer our questions.
Sailfish Analyser is here; https://techsail.com/
You need to collect a lot of information about your boat to feed into the VPP. The IRC is a good starting point as is the measurement data for your boats sails. We did trawl the Techsail database for equivalent boats to use as a basis for our modelling rather than start from scratch with a tape measure. That was particularly useful for the hull shape measurements.
Routing Software
Predict Wind
We have made extensive use of Predict Wind’s routing software and forecast models over the last couple of seasons. You have to pay extra for the weather routing options but it is worth the investment. Predict Wind are here; https://www.predictwind.com/
qtVlm
qtVlm – is another routing programme. We have installed this on Rockit Server devices. You can find out more about how to do that here;
qtVlm Routing Software
OpenCPN
OpenCPN we also experimented with. The Rockit Server device will run the Linux version of OpenCPN so you can install the software and related cartography locally on the server. You can find out more about OpenCPN here;
Open CPN Installation