Overview
The Boat page on the Rockit Analytics Platform reproduces a lot of the functionality that exists on the Boat Management Screen on the local install of Rockit. Unlike the local copy this information can be shared with your crew.
We describe how to setup a boat for data collection in the earlier section; see the link below. This section talks about the data that is collected by Rockit and held for each boat.
Follow the link below to navigate to that section.
Rockit Analytics Platform : Setup
Section Two : Computed Boat Polars
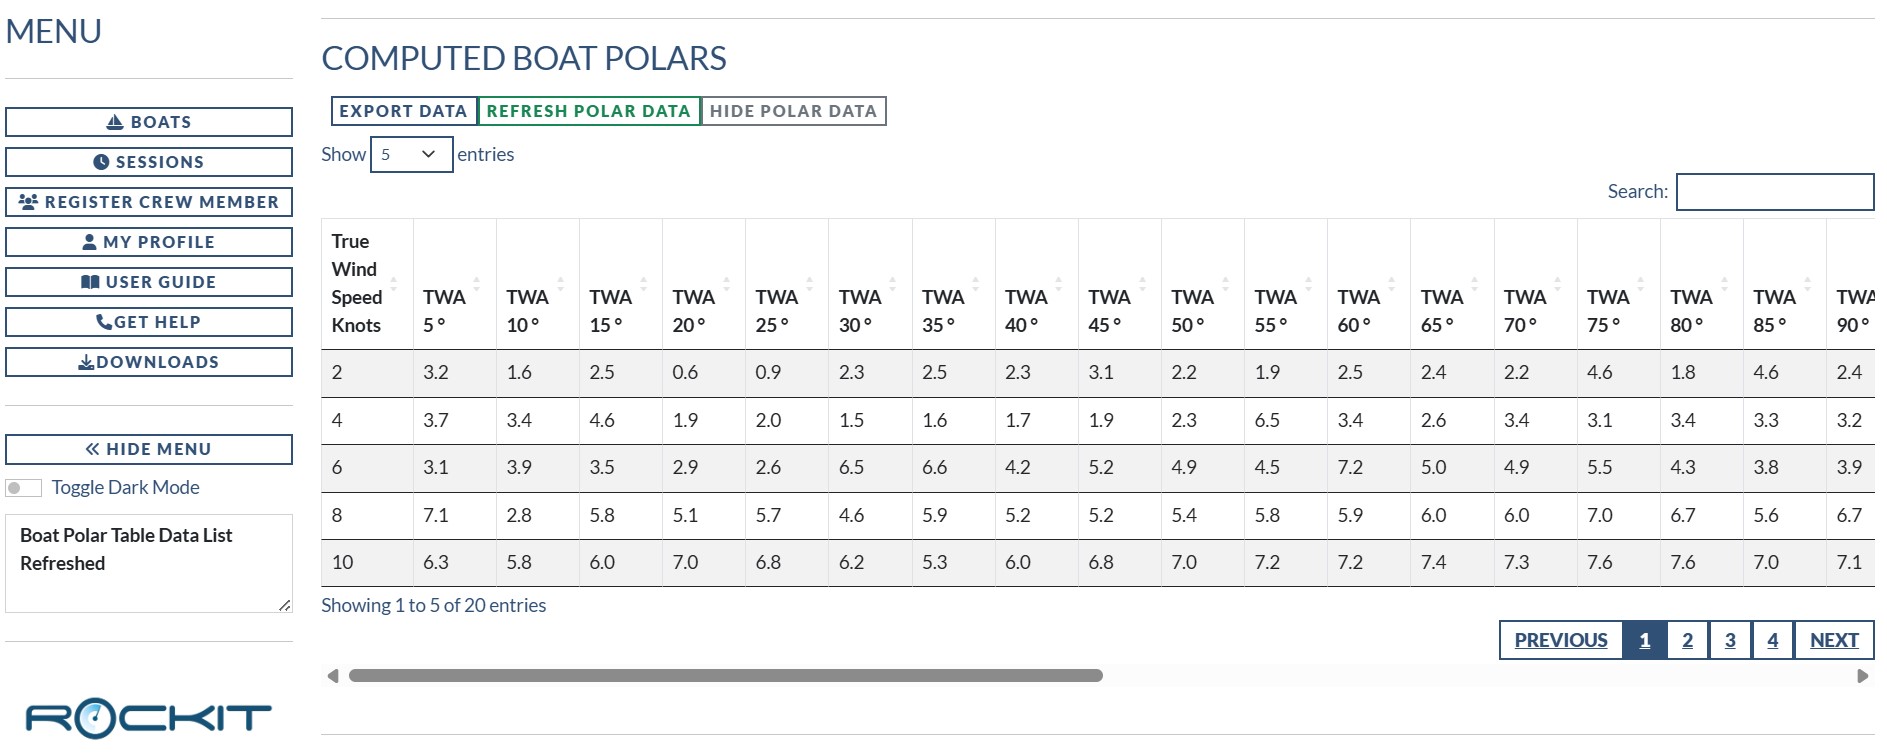
The computed boat polars are a combination of Session Polars and the Velocity Predication Programme Polars uploaded to the Rockit Analytics Platform. The values displayed for each True Wind Angle/True Wind Speed combination will be the higher of those two sets of numbers. So if you are sailing faster than your VPP polars that will be the number you see here; if not you will see the VPP Polar value. These number are the ones used to calculate the target boat speed and percentage achieved that Rockit displays whilst collecting data.
The data in the computed boat polars table is used for the following Polar data plots.
Linear Polar Plot
The first graph is a simple plot of the true wind angle against the boat speed with the different lines representing different True Wind speed bands.
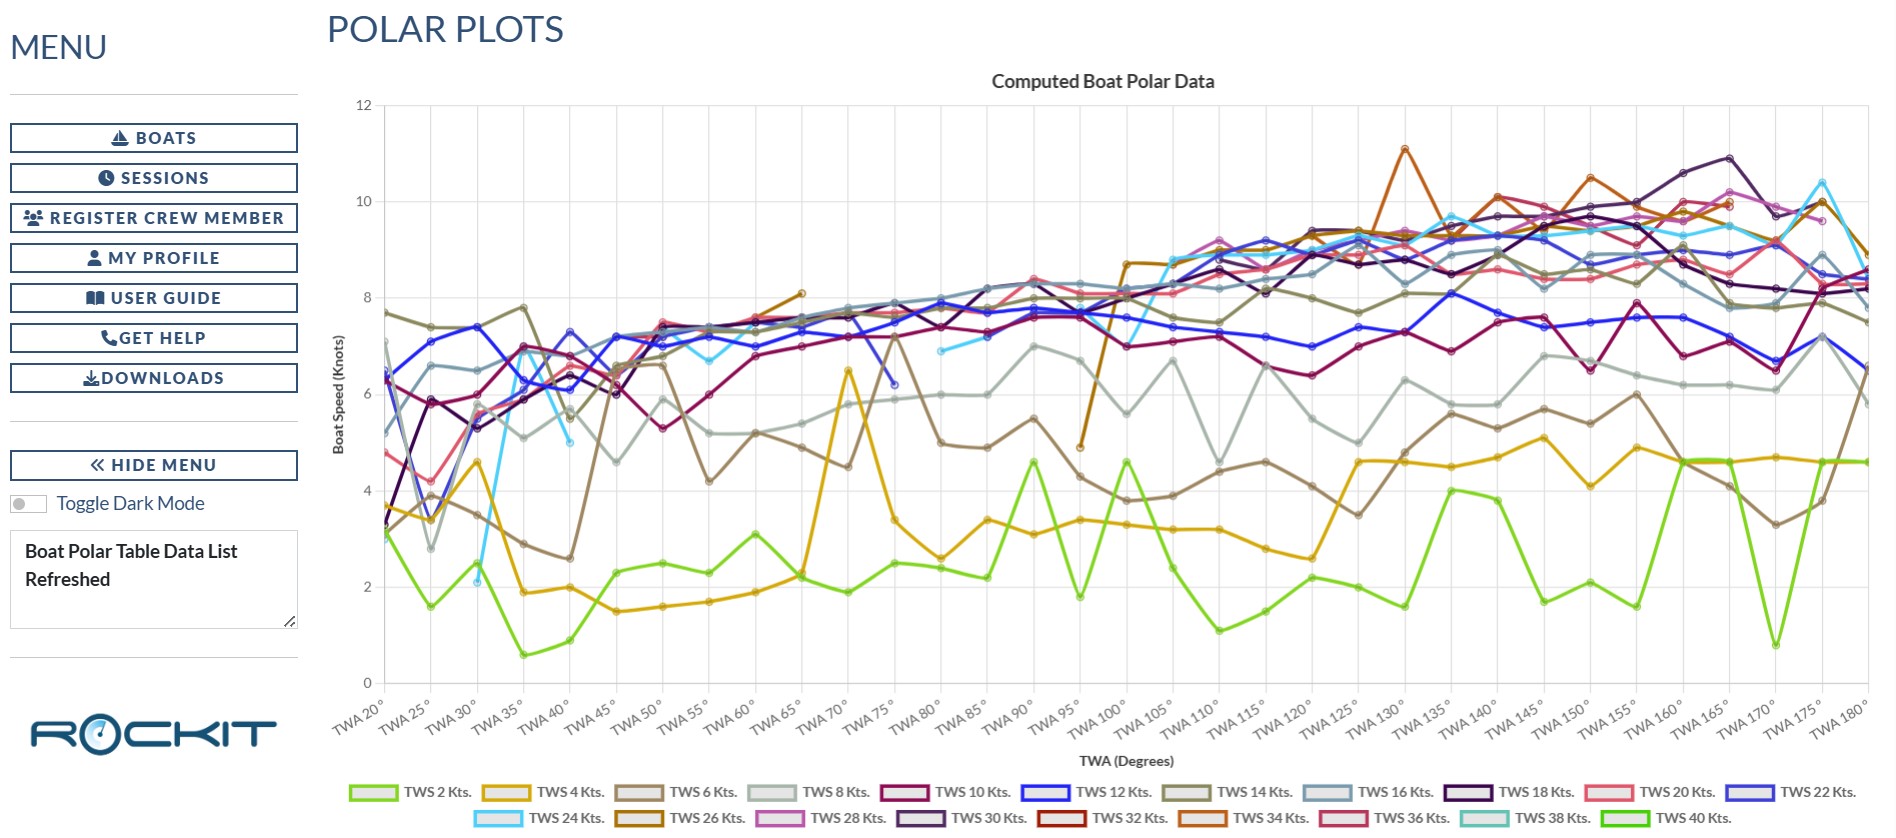
Right clicking on the graph image on the page will bring up a context menu that will allow you to save the graph as an image file. You can also zoom in and out of the graph and hovering over the data points will bring up a label to display the data values.
The line plots will only display data points where data has been recorded. So, as in the example above, you may get a broken line and potentially if there are very few sessions that recorded data for that true wind speed/true wind speed angle you may get data points that deviate from a smooth line. The plot also starts at 20 degrees to true wind not zero degrees as that would effectively be head to wind.
Radar Polar Plot
The second graph/chart is a more conventional radar style Polar Chart. Data is plotted in series with 5 degrees True Wind at the top 95 degrees True Wind Angle at the bottom.
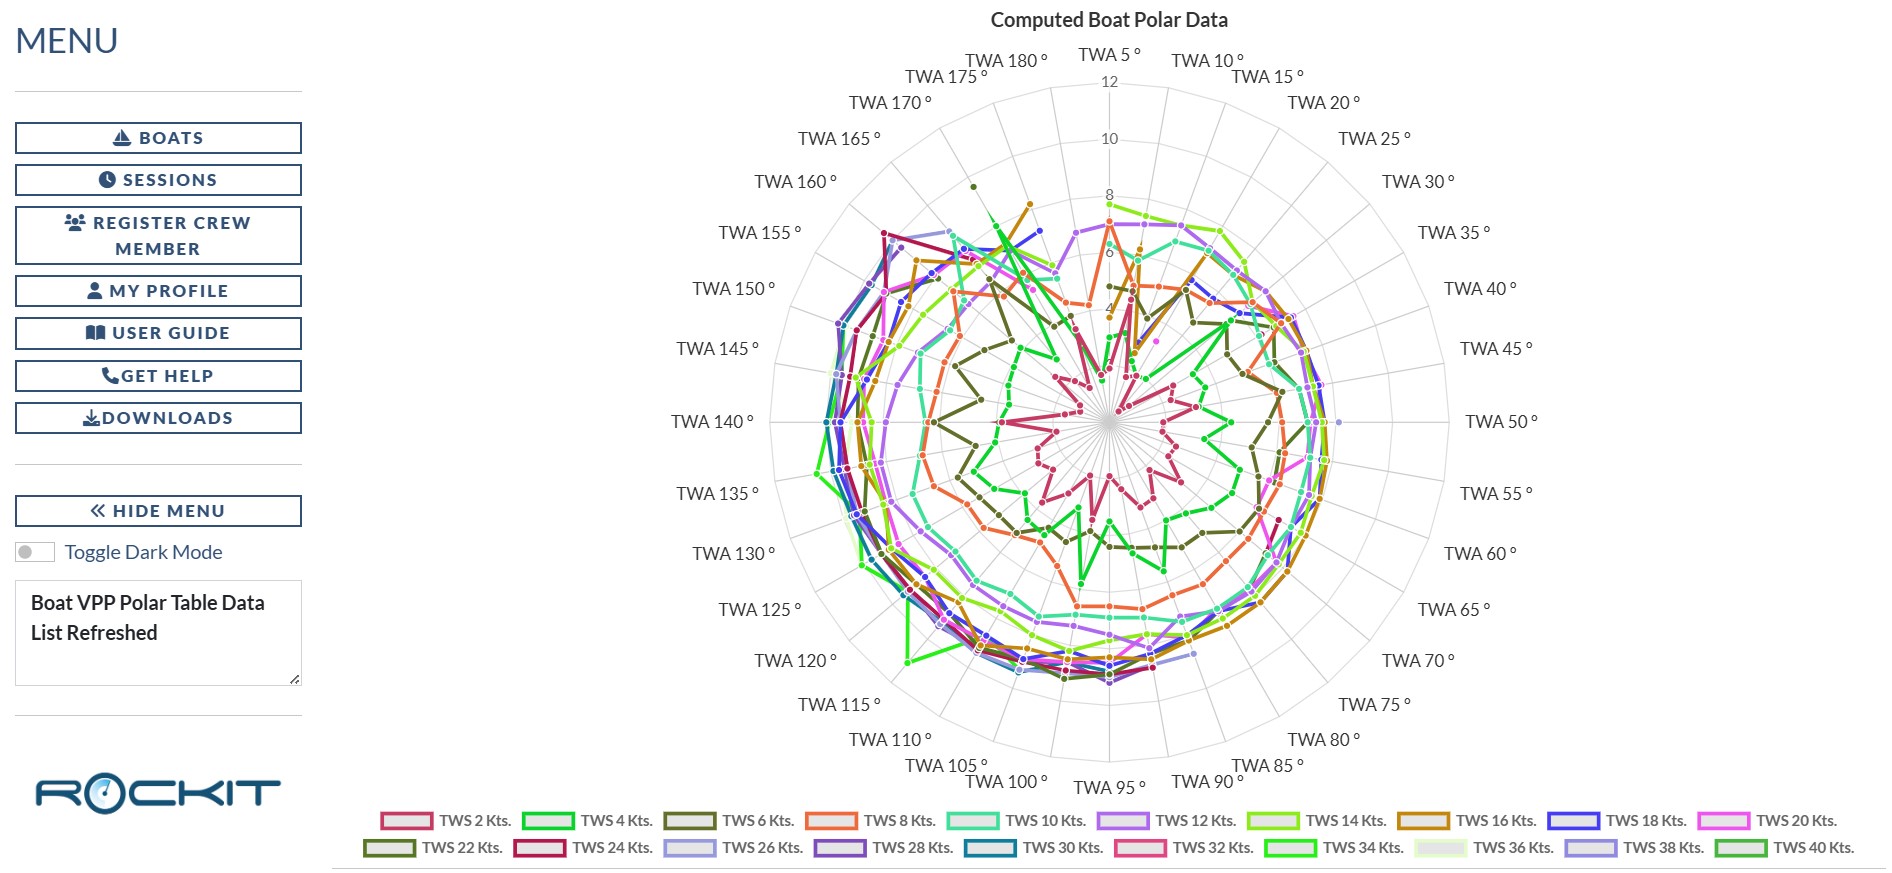
As with the line charts you can hide the individual true wind speed series by clicking on the coloured box next to the speed key at the bottom of the graph panel. Clicking the pink box next to TWS 2Kts about will hide the 2kts line.
Section Three : Peak Performance Configuration
We record the configuration of the boat for every timeslot in a session. We also record the boats performance. This means we can look at a specific Wind Speed/Wind Angle combination and ask what the boat configuration was at that point in time. We use the Peak Performance Configuration panel to examine that profile.
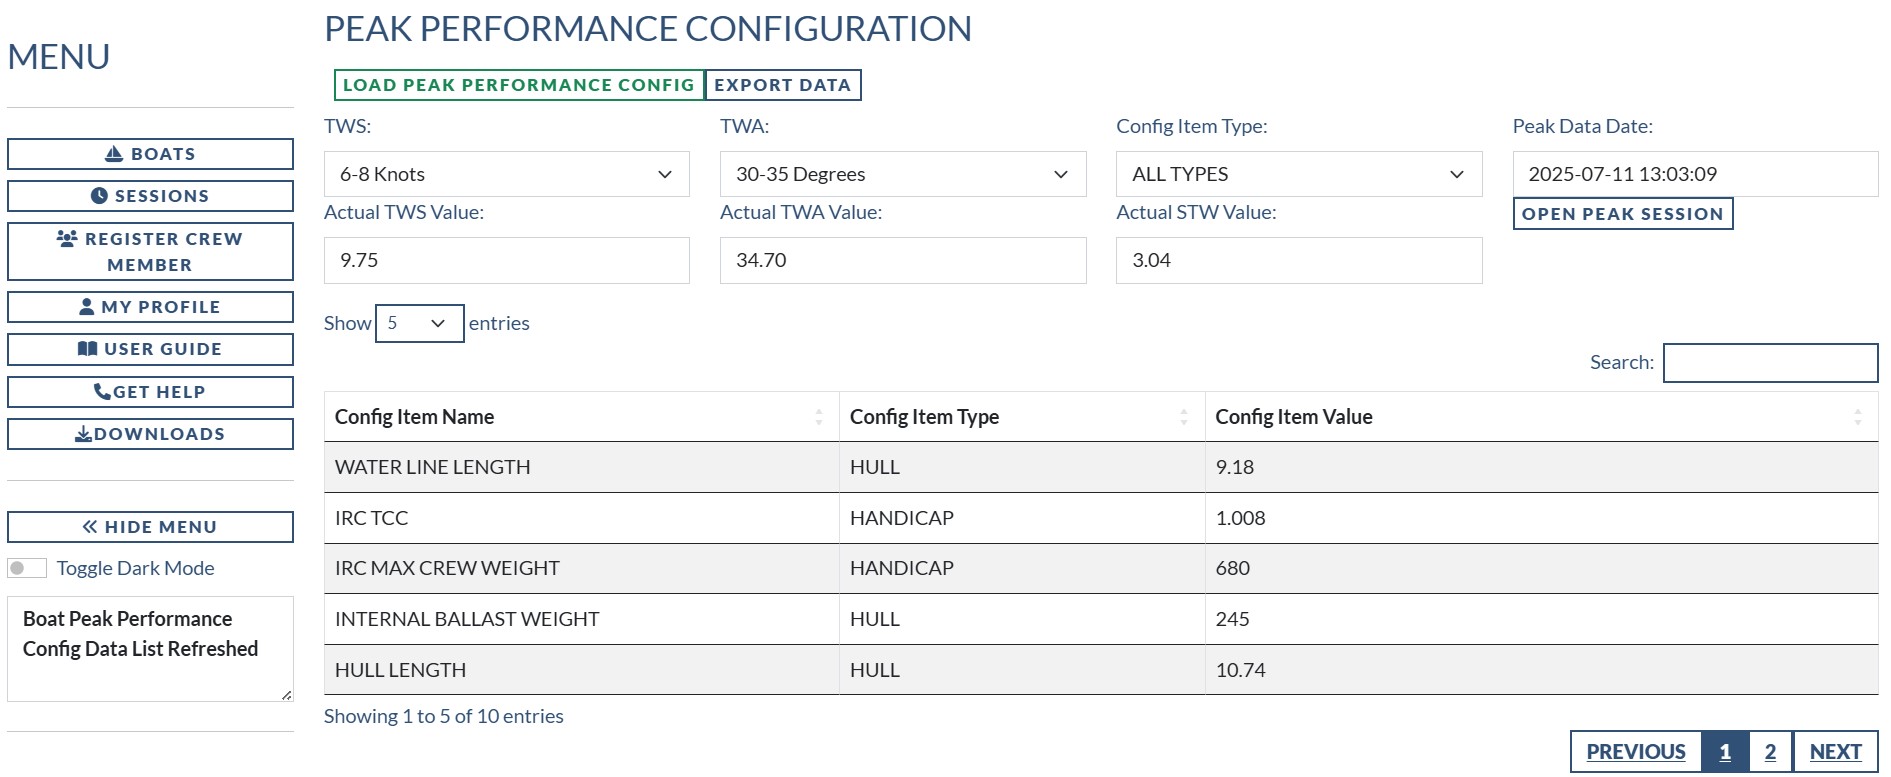
This panel is straightforward to interrogate.
- Pick a True Wind Speed from the drop down list.
- Pick a True Wind Angle from the next drop down list
- Pick the Configuration Item type you are interested in from the final drop down list (or ALL Types if you want everything)
- Click the Load Peak Performance Config button
The table will be populated with the configuration information for the best performance timeslot for that TWS/TWA combination.
Obviously if the boat has never sailed in those conditions there won’t be any recorded data so you won’t get any configuration information back.
You can use the Open Peak Season button to open the session that relates to the records that do come back. That will open the session where the boat sailed fastest for this combination of TWA/TWS.
Section Four : VPP Base Polars
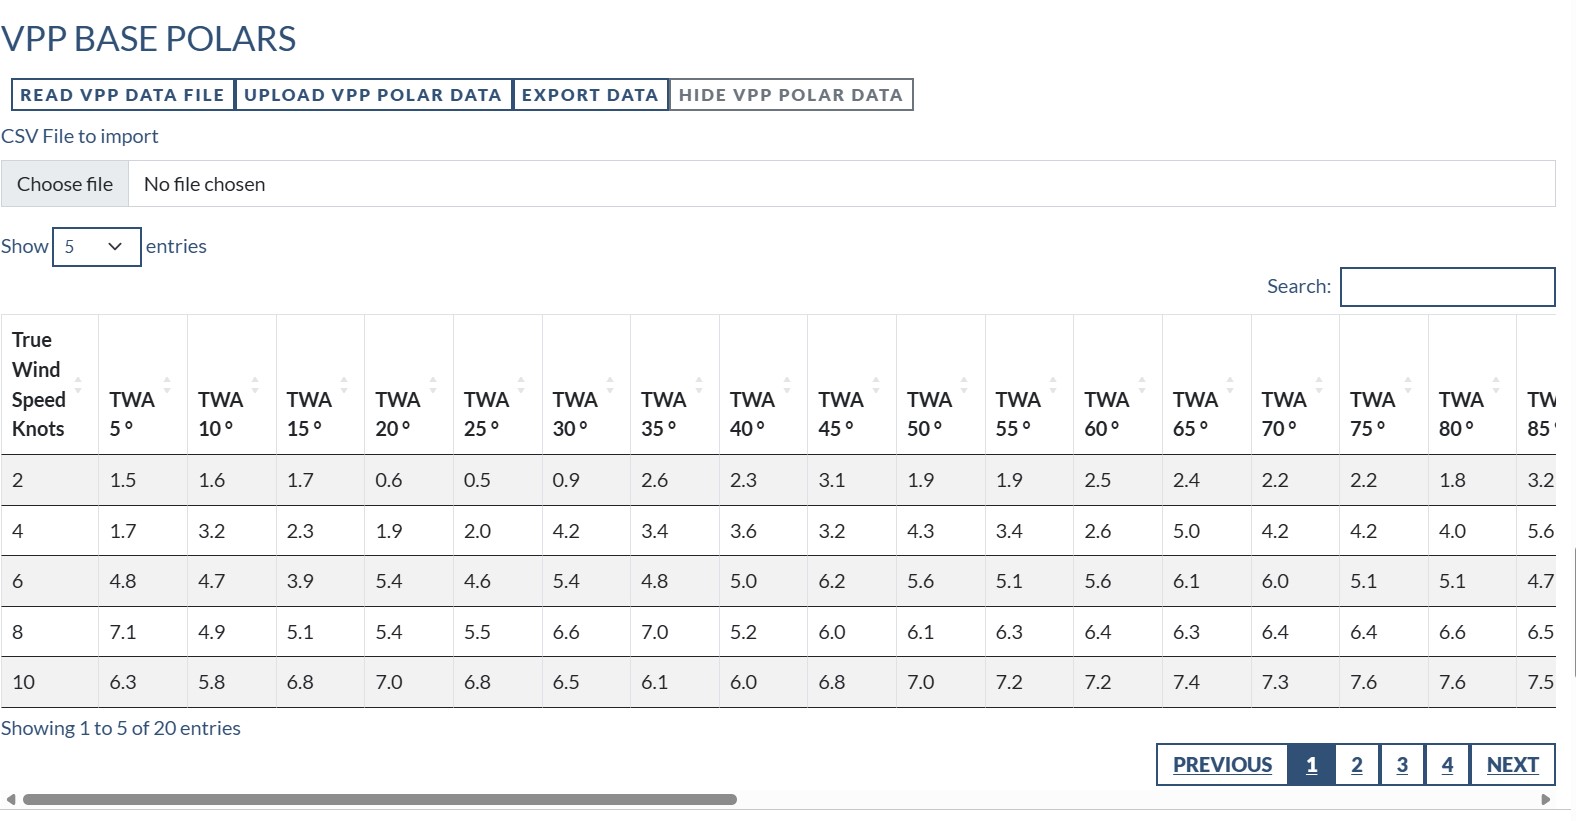
The VPP Polars and how to upload Polar information is covered on the link below;
Rockit Analytics Platform : Setup
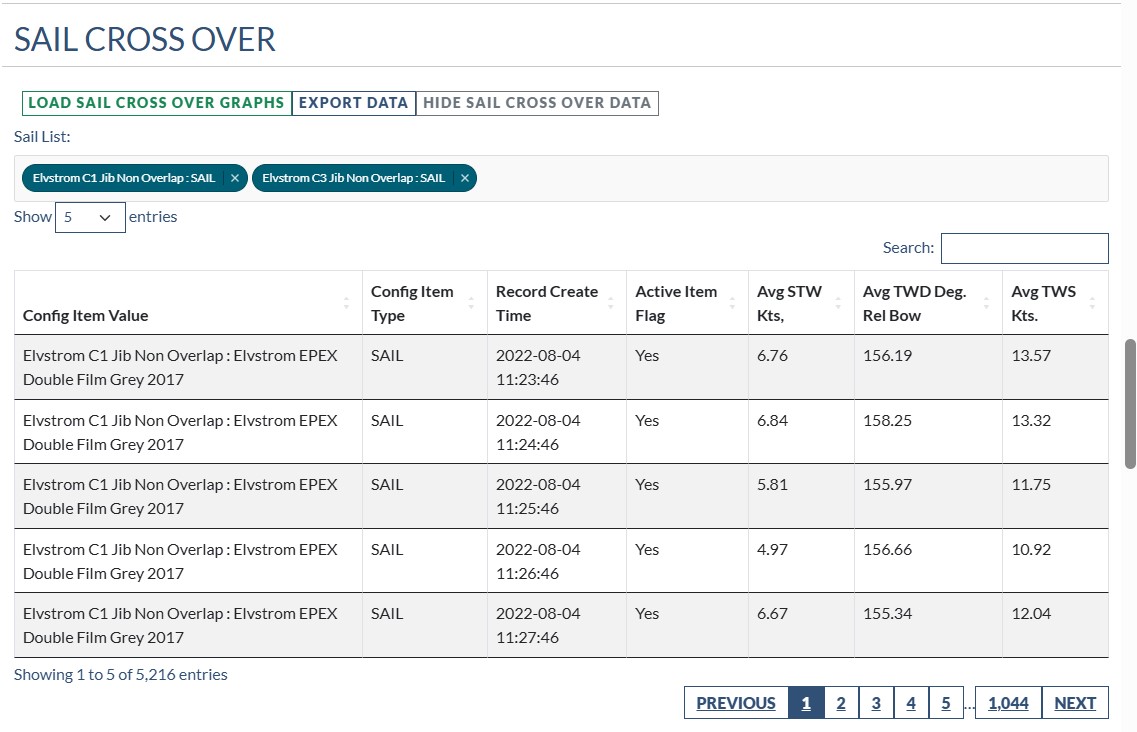
Section Five : Sail Cross Over Charts
The Sail Cross over charts on the boat page work in the same way as the Sail Crossover graphs at the Session level.
- First select the boat you are interested in.
- Then select the sails from the list that you are want to know about
- Finally press the Load Sail Cross Over Graphs button.
The data for this set of graphs comes from all of the sessions where the sails have been used recorded against this boat. For the example in the image below there are two sails and they have collectively been used on 5216 timeslots for the selected boat. If you have that sort of volume of data it can take a couple of minutes to extract he information from the Rockit Analytics Platform and display it on the screen.
You will get the information in 4 formats;
1 Basic Table Of Data; a row for each Timeslot occurrence.
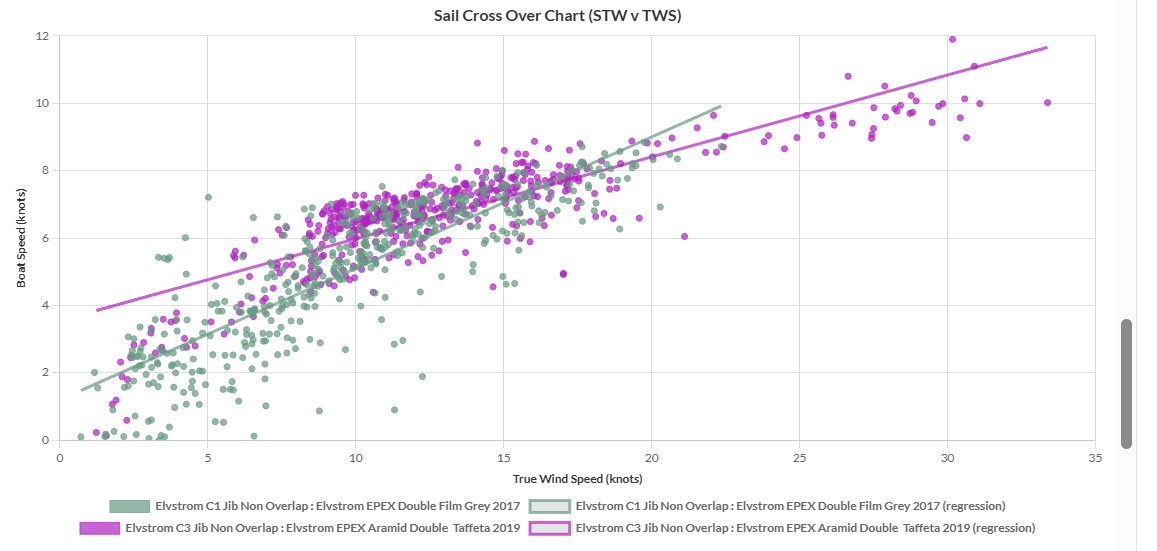
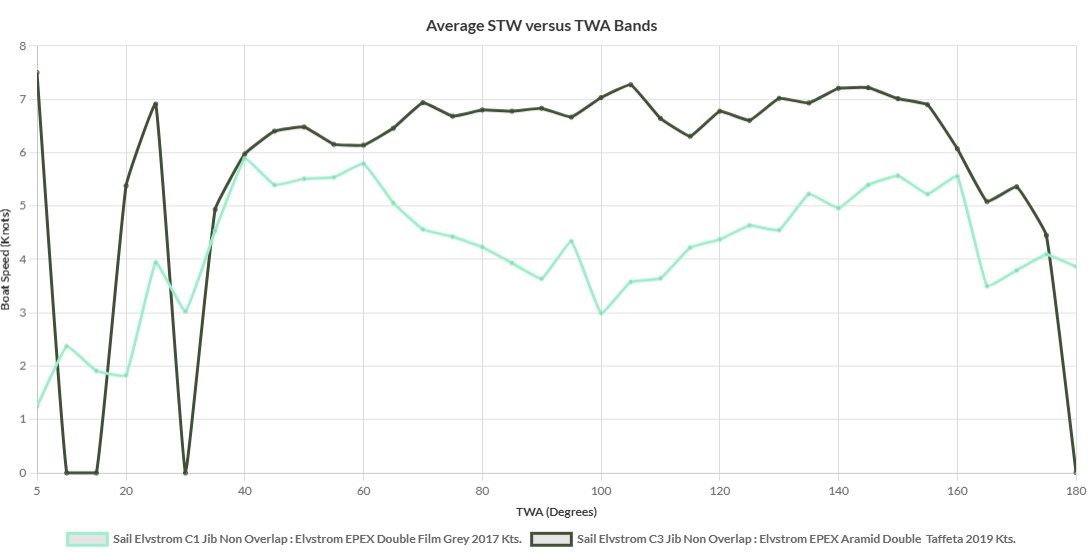
2 Sail Cross Over Graph; Speed Through Water versus True Wind Speed
3 Sail Cross Over Graph; Speed Through Water versus True Wind Angle
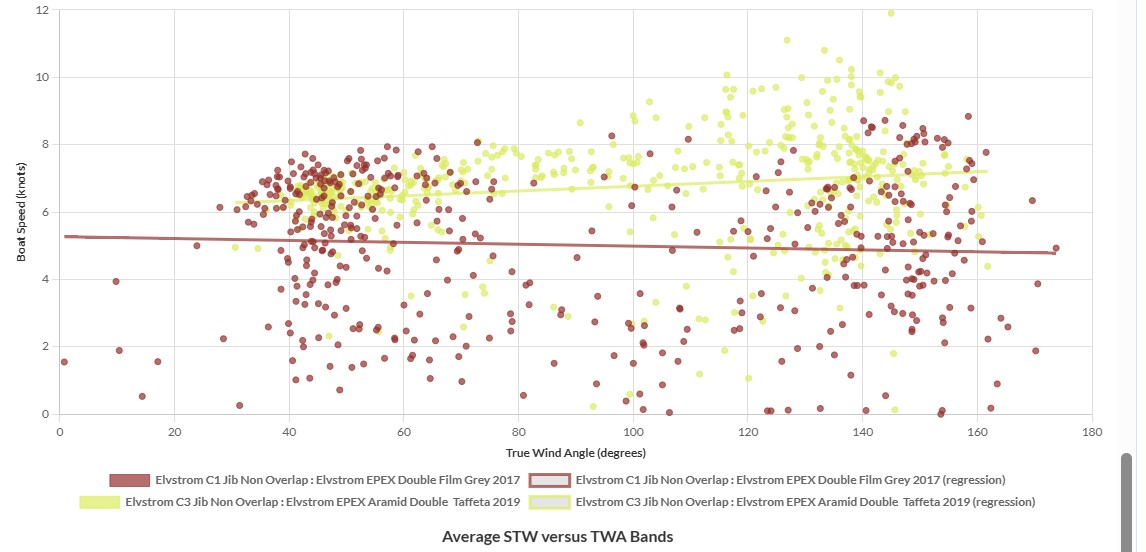
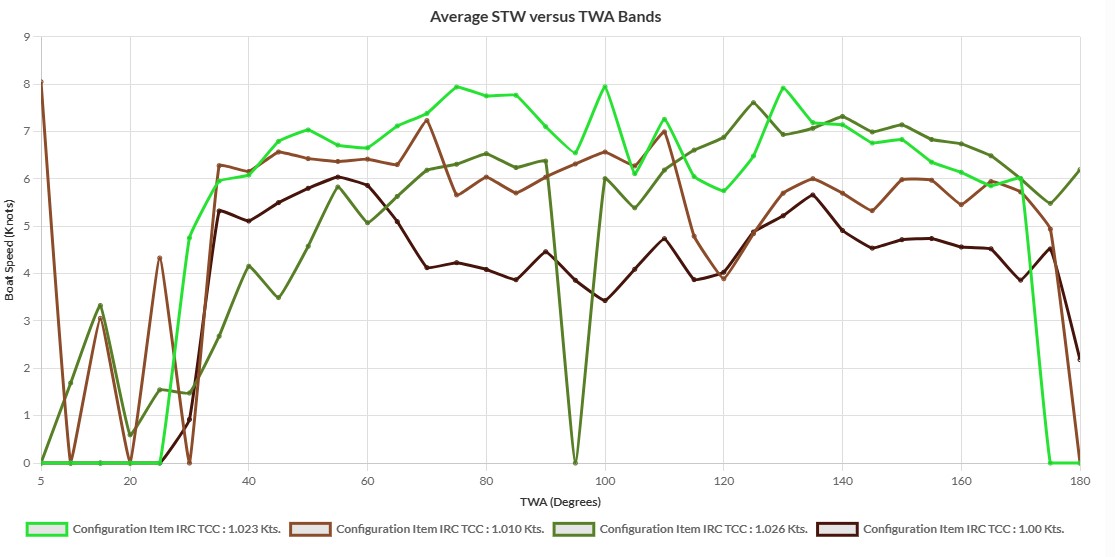
2 Sail Cross Over Graph; Average Speed Through Water versus True Wind Angle Bands (matching Polars)
Section Six : Non Sail Configuration Cross Over
Non Sail Configuration Cross Over works in the same way as the Sail Cross Over.
- Pick a configuration item from the list.
- Click Load Non Sail Cross Over Graphs
- Review the information.
As with the Sails you will get a table of data and 3 graphs.
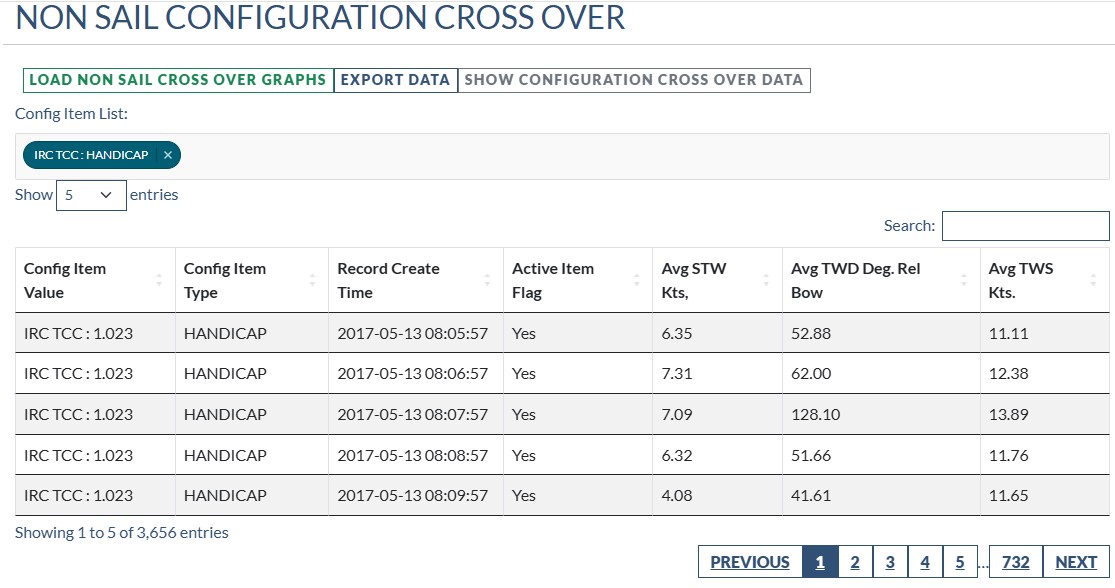
This is useful if you do something like change your IRC Handicap. The data groups the Configuration Item Name and the Value together; IRC TCC and 1.023 or 1.010 depending on the value. See the section on managing the Boat Configuration for more information on how to record this type of information.
Rockit 2025 : Setting Up A Boat In Rockit To Record Data Against
Because the data is grouped together we can see how changes to TCC or another configuration value are reflected in the boats performance. This is a great way of working how which of you Helms is most on the ball ….. !
There are 3 standard graphs
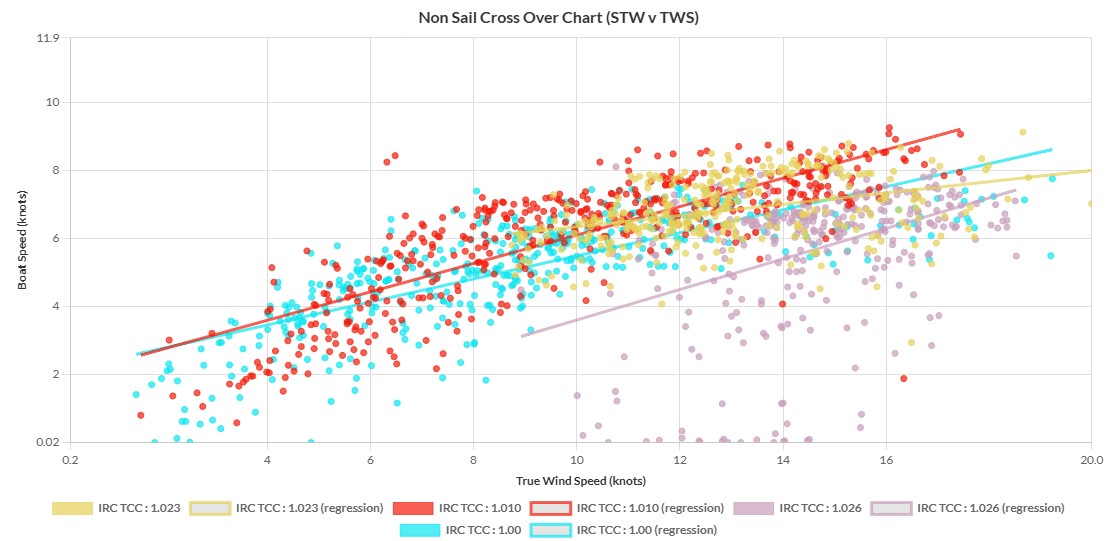
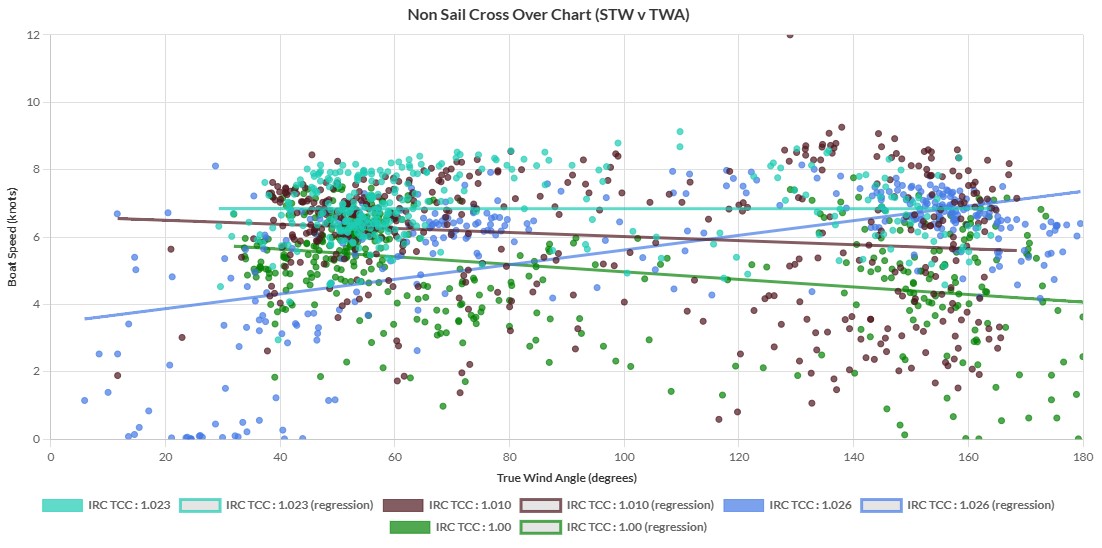
These graphs behave in the same way as all the other graphs we have described. So you can zoom in/out, turn plots off and save the graph as an image file.
As with all the other graphs if you haven’t recorded the boat sailing in a specific wind speed angle combination you won’t get an data back.