Overview
The Rockit Analytics Platform holds the summary data that Rockit software local to the boat collects and computes. It doesn’t hold the actual raw NMEA 0182 or 2000 messages as that would require uploading significantly more data. The raw data remains in the local database on the Rockit Server or Windows computer.
The summary data is used to analysis the performance of the boat. Data is recorded at session level then aggregated to the boat level to provide information such as calculated boat polars.
This section of the User Guide talks about the information displayed on the Session Page.
Section One : Recording Session List and Edit Panel
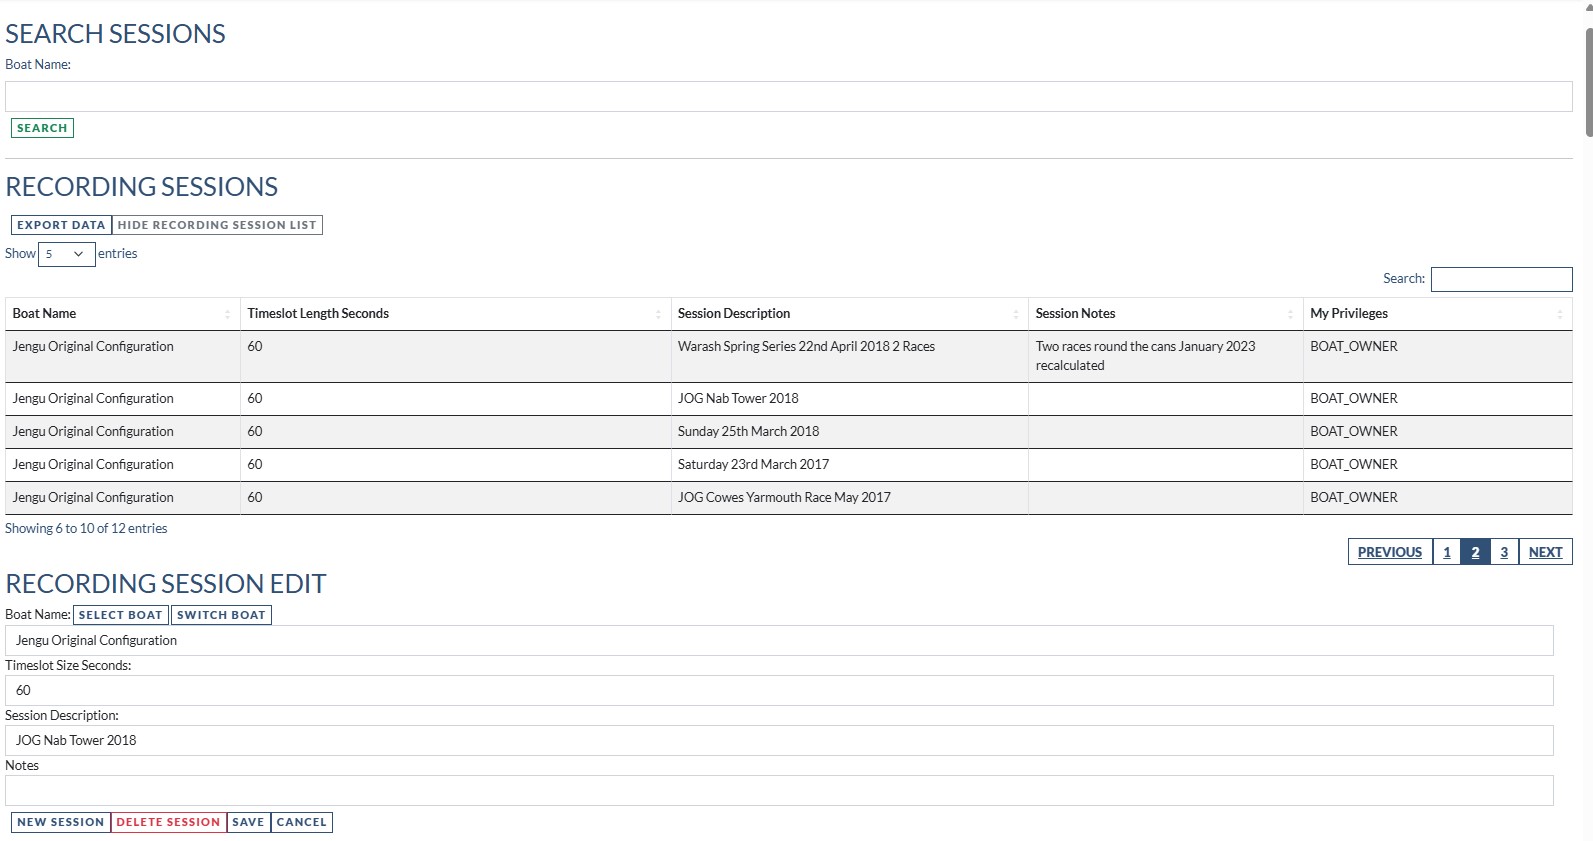
This gives you a list of the sessions that have been uploaded to the Rockit Analytics Platform that you have access to. That can be because you are a Boat Owner or because you are a Crew Member for another boat and the boat owner has shared the boat information with you. If the boat has been shared with you then you will have access to all of the sessions that have been recorded for that boat.
There are two ways to search the Recording Session list.
- Enter a Boat Name and press the search button below the Boat Name text box
- Press the search button without a specific Boat Name to filter by then enter a search term in the Search box above the result set table then press return. That will search all the data in the table for the string you enter.
Once you have found the session you were looking for in the table you can double click the row in the table to select it.
That will put the details in the text boxes on the Recording Session Edit panel.
You can edit the following fields
- Session Description : Change the descriptive information recorded about the session
- Notes : Enter more details notes about the session
Bear in mind that if you have to reload a session from the local copy of the data; on a Rockit Server or Windows computer this information will be overwritten. If that it a possibility then it makes more sense to make any session related changes on the local copy of the data rather than that held on the Rockit Analytics Platform.
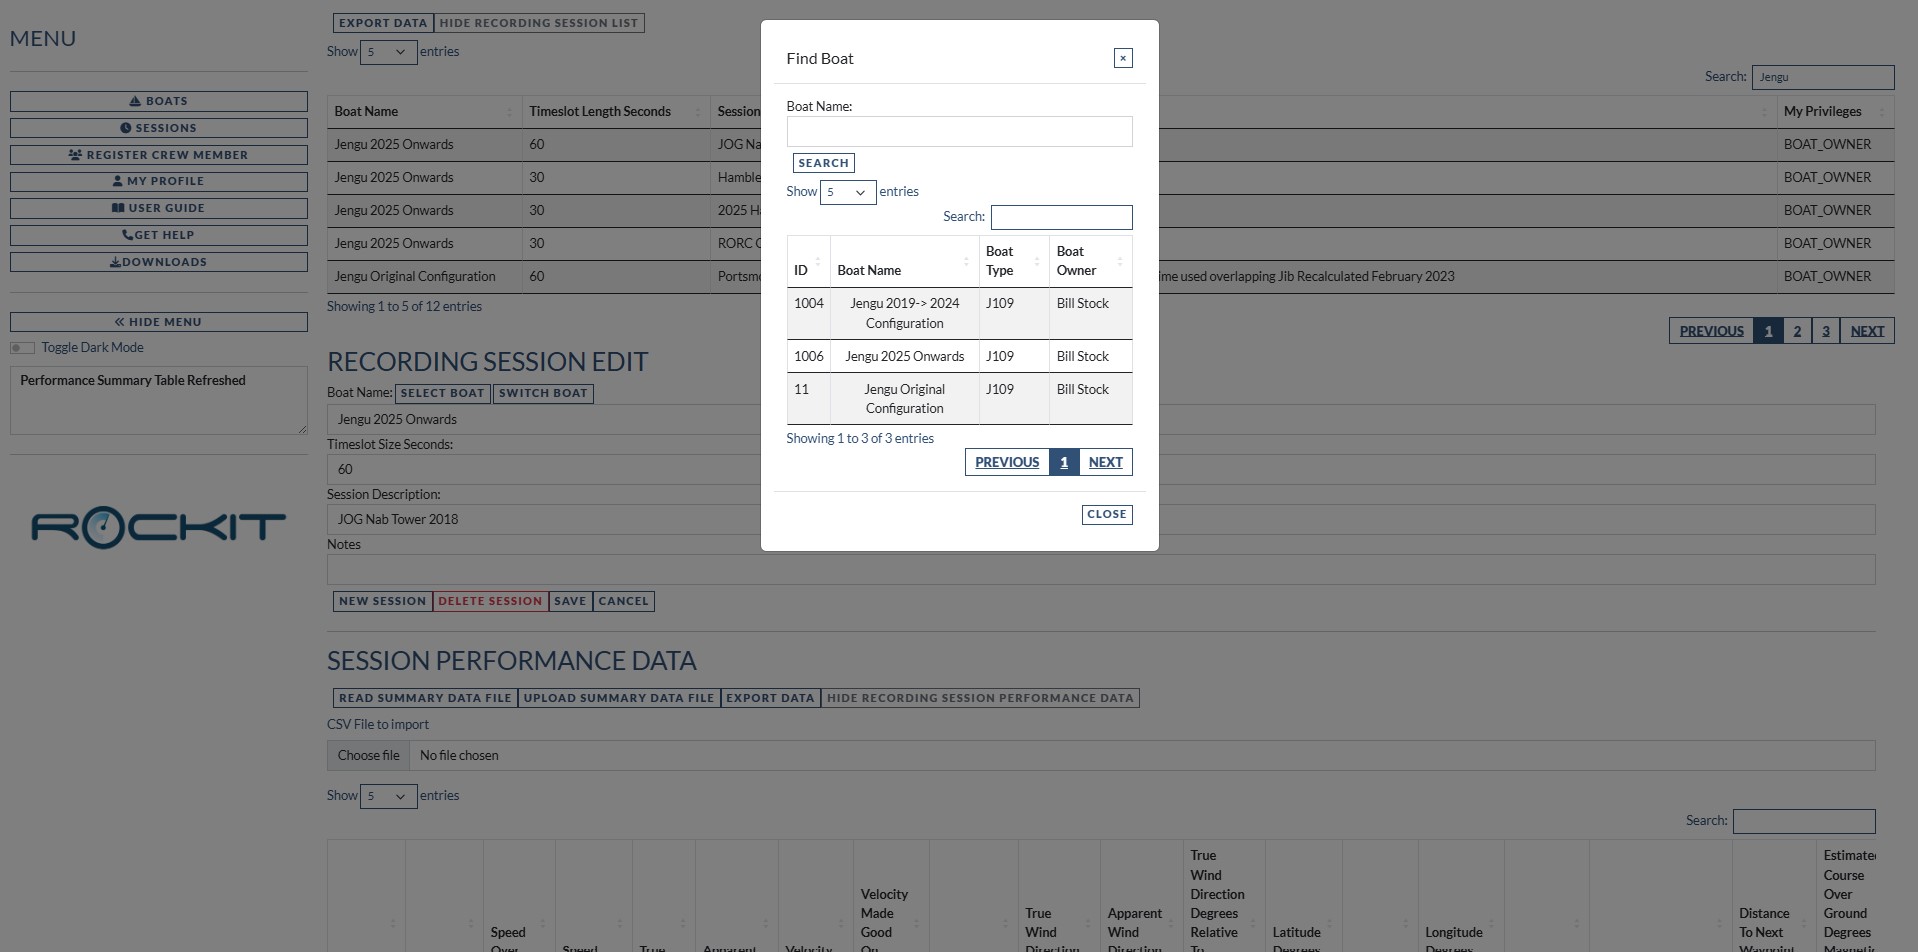
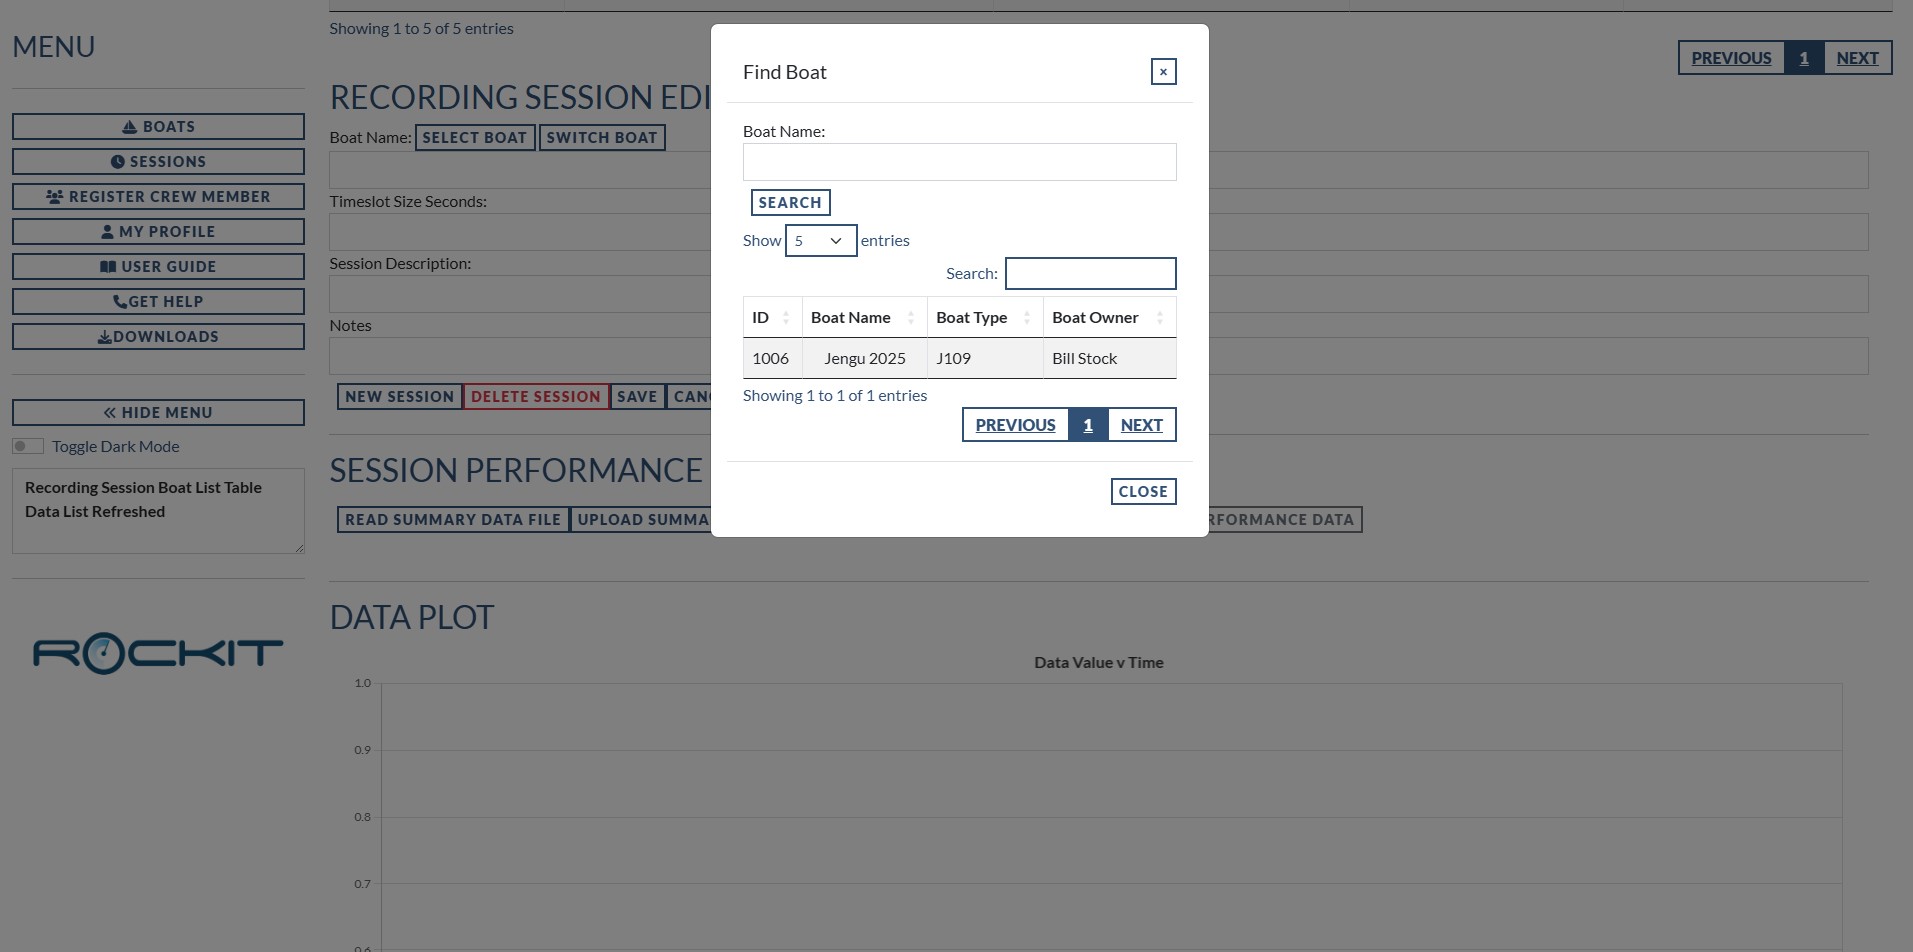
You can also change the boat that a session is associated with using the Switch Boat button.
- Click the Switch Search button
- Press Search on the Modal dialog that is displayed
- Click on the boat that you want to shift this session to.
This will update the data for this session, Time Boat Config Items, Polar data and Performance data, switching it over to the new boat. If you don’t like the result you can switch it back using the same method.
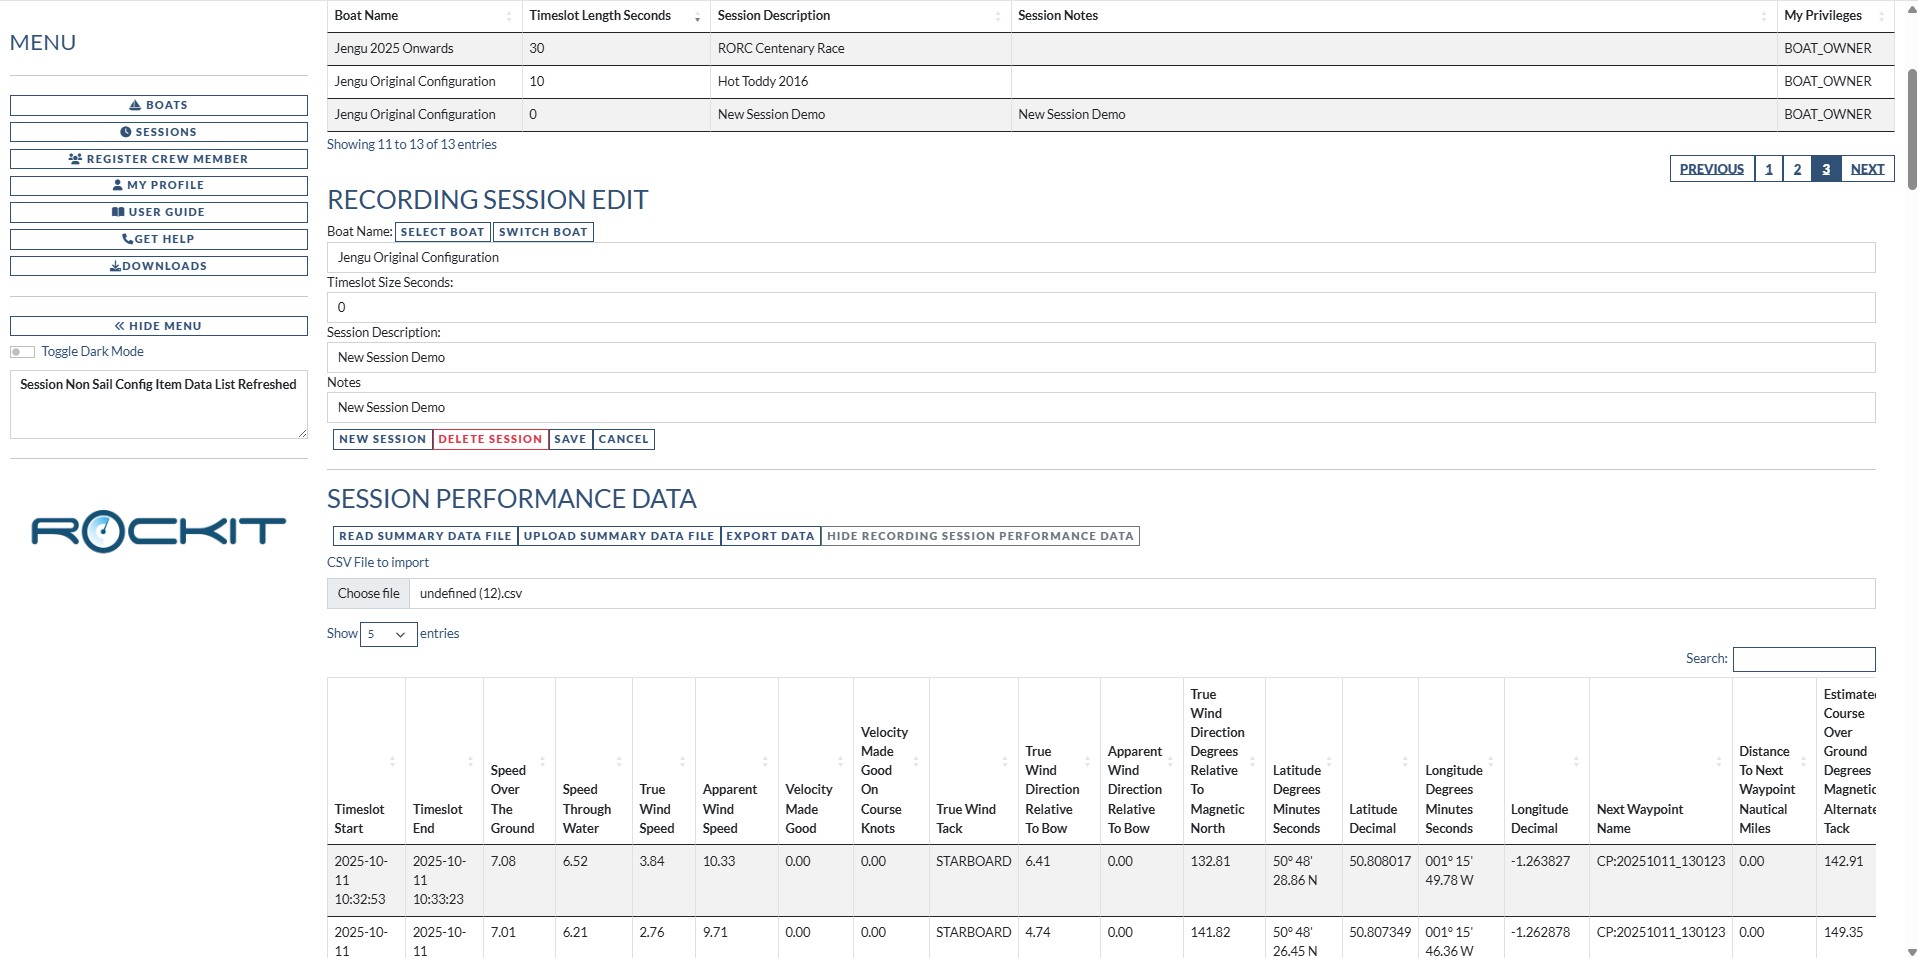
Section Two : Session Performance Data
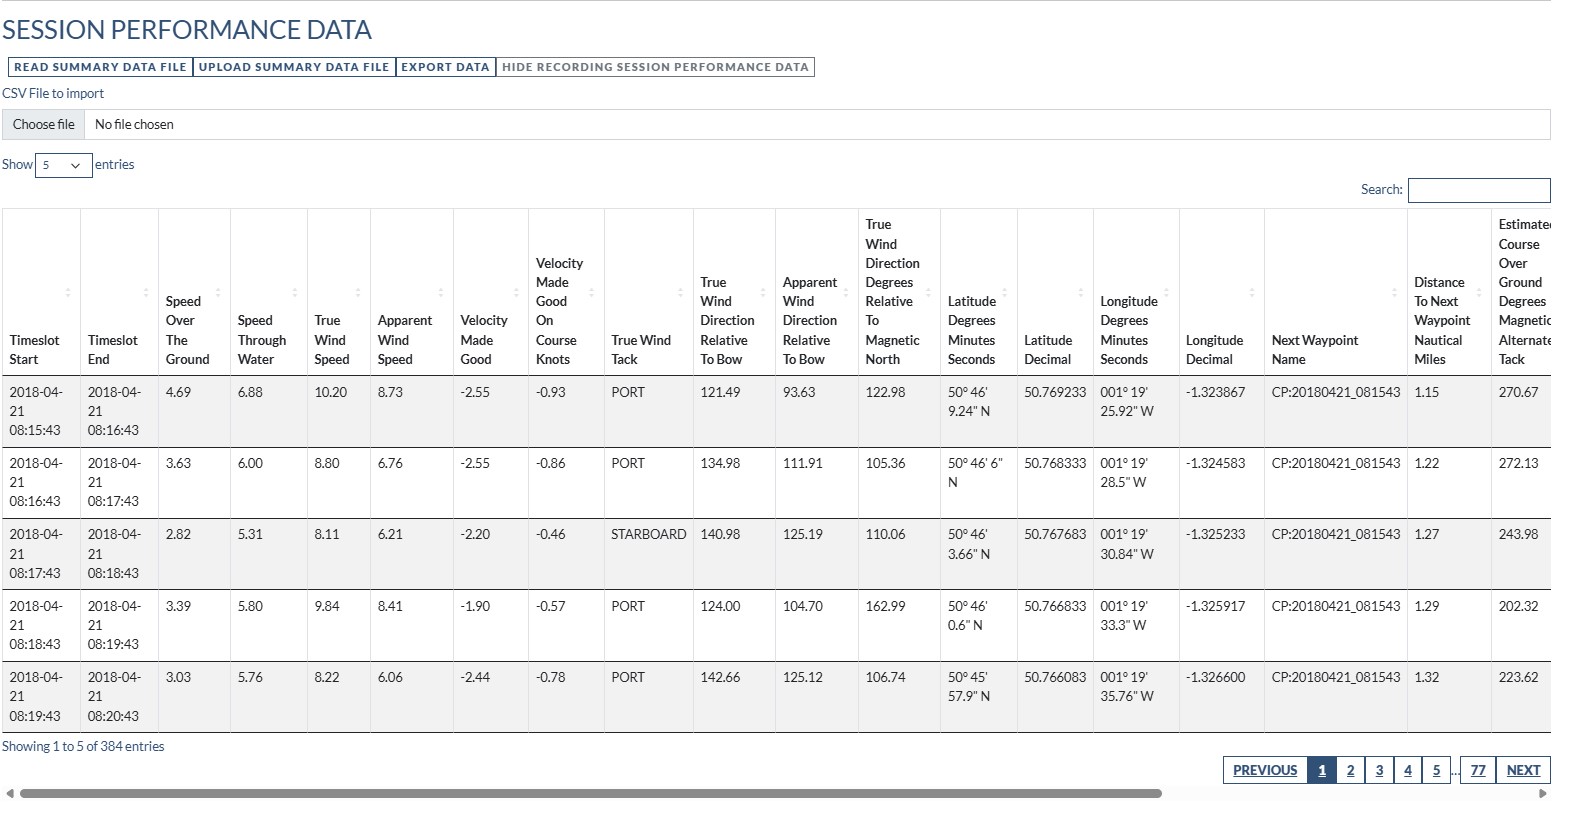
This table contains the summary data that Rockit calculates from the raw NMEA data that it collects.
Each row represents the averages or the end point for a timeslot. For instance, the Speed Over Ground number will be the average number for a timeslot. Latitude Decimal will be the latitude at the end of the timeslot.
Some values for instance rig load values are only populated if the data is collected from NMEA 2000; and an appropriate rig load sensor needs to be present on the boat to collect the data. The same is the case for Trim/Yaw numbers without an appropriate sensor generating NMEA values Rockit won’t collect the data.
The values in this table are used to produce the graphs in the next section.
You can find the complete list of data points collected here.
Data Points Collected By Rockit
Section Three : Performance Data Plots
Data Value v Time Graph
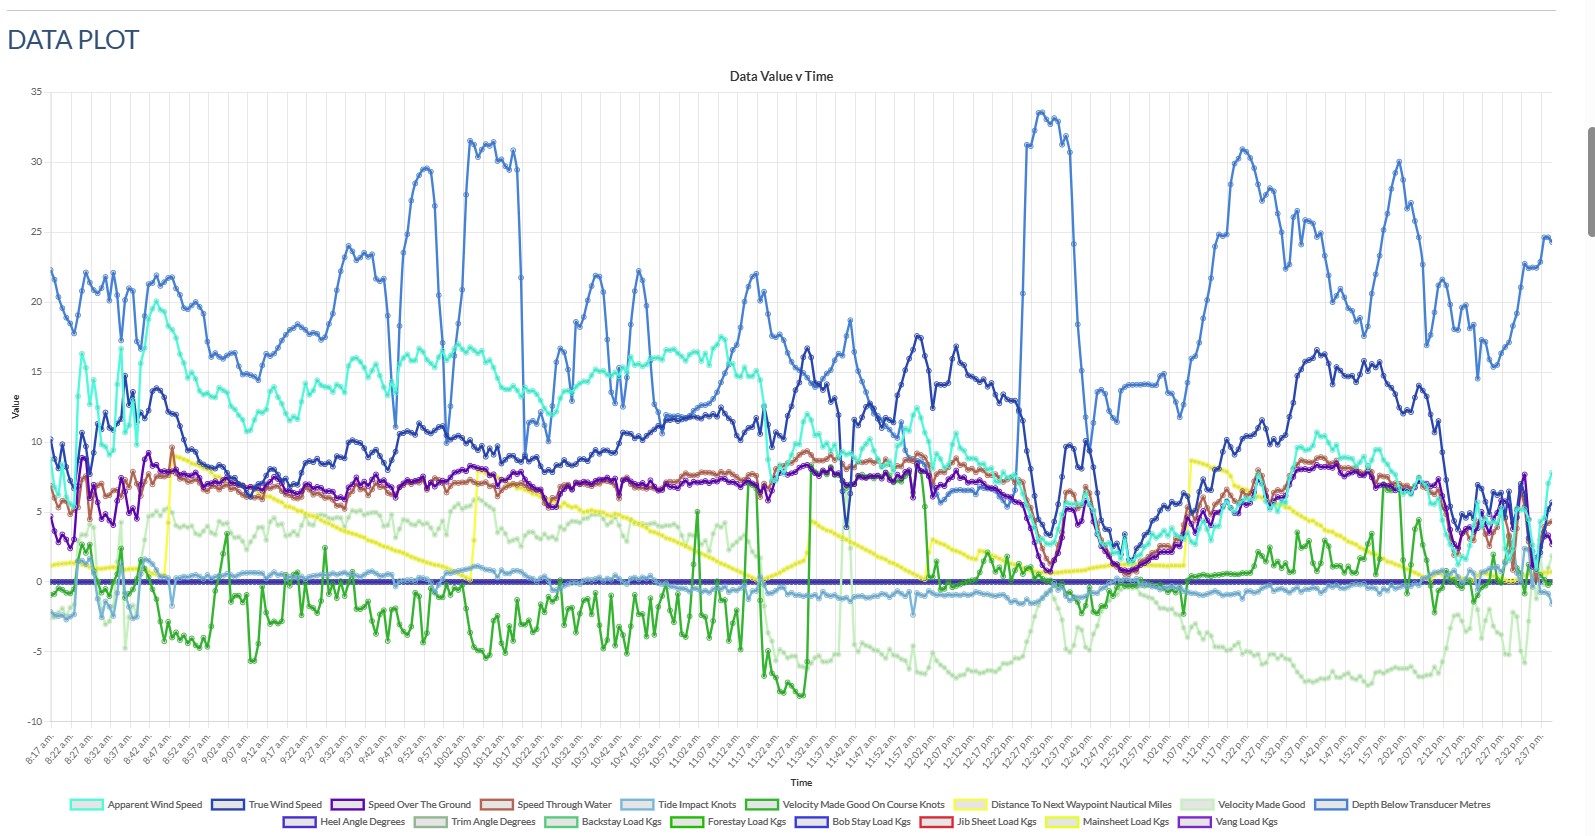
This graph plots the majority of the variables in the Performance table against the timeslot.
- You can turn individual timeseries on or off by clicking the coloured box in the key under the graph.
- You can also zoom in or out to inspect specific parts of the graph.
- Hovering over a point on the graph will bring up a label showing the series name, value and time.
- Where the is no data or a zero value for a variable the plot will be a straight line at the 0 axis
This functionality is available on all of the graphs.
Boat/Wind Direction Versus Time Graph
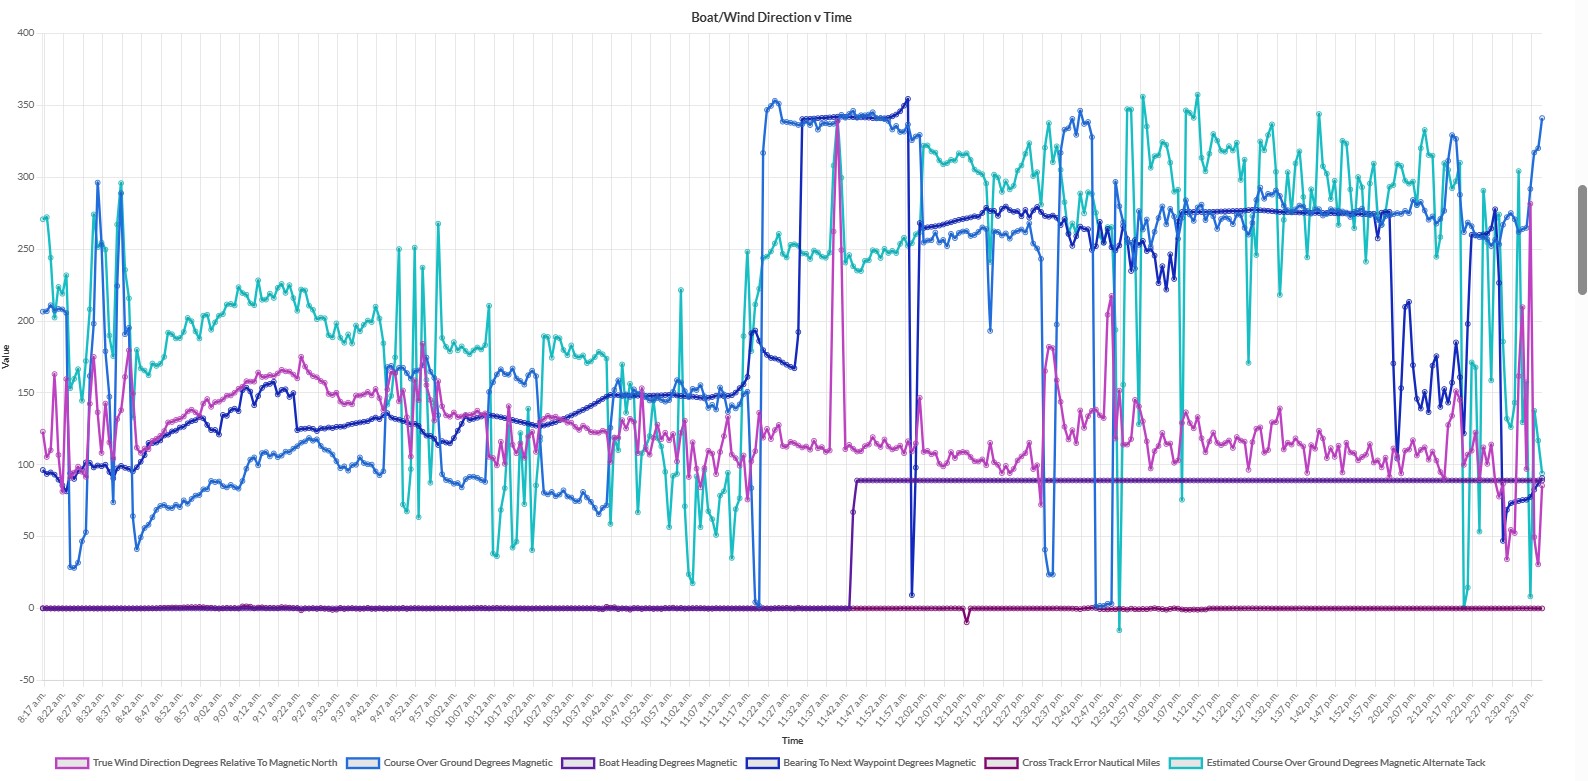
This graph works the same as the previous one.
We pulled the direction related information onto a separate graphic because the scale of the axis would be significantly different 0-20 or so knots for the speeds in the previous graph versus 0-360 the bearings in this graph.
Absolute Wind Direction Versus Time Graph
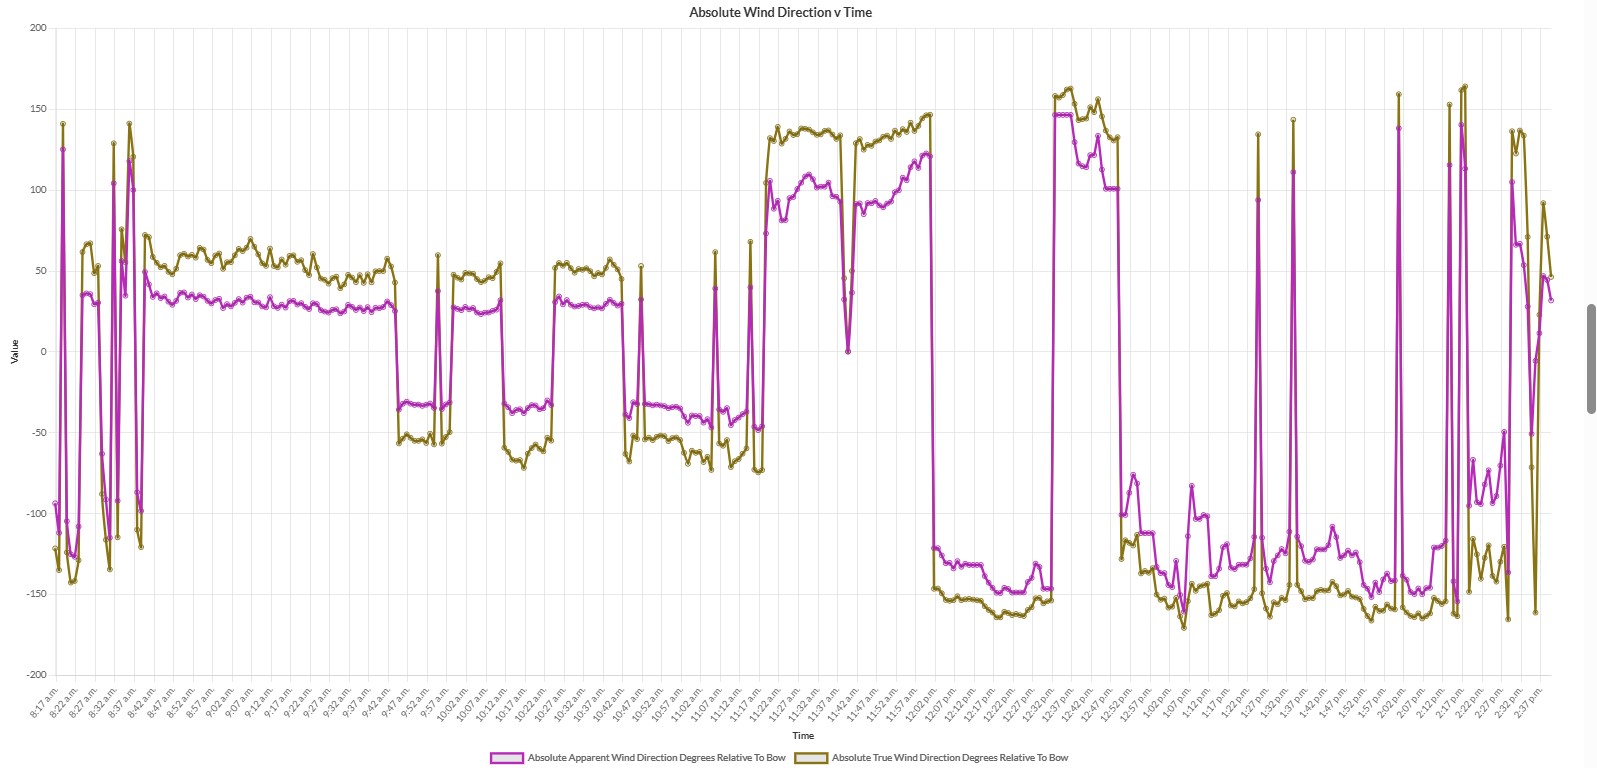
We plotted this one because we were interested in how high the boat was pointing. As with the previous graph the axis range made it easier to understand if it was on a separate graphic.
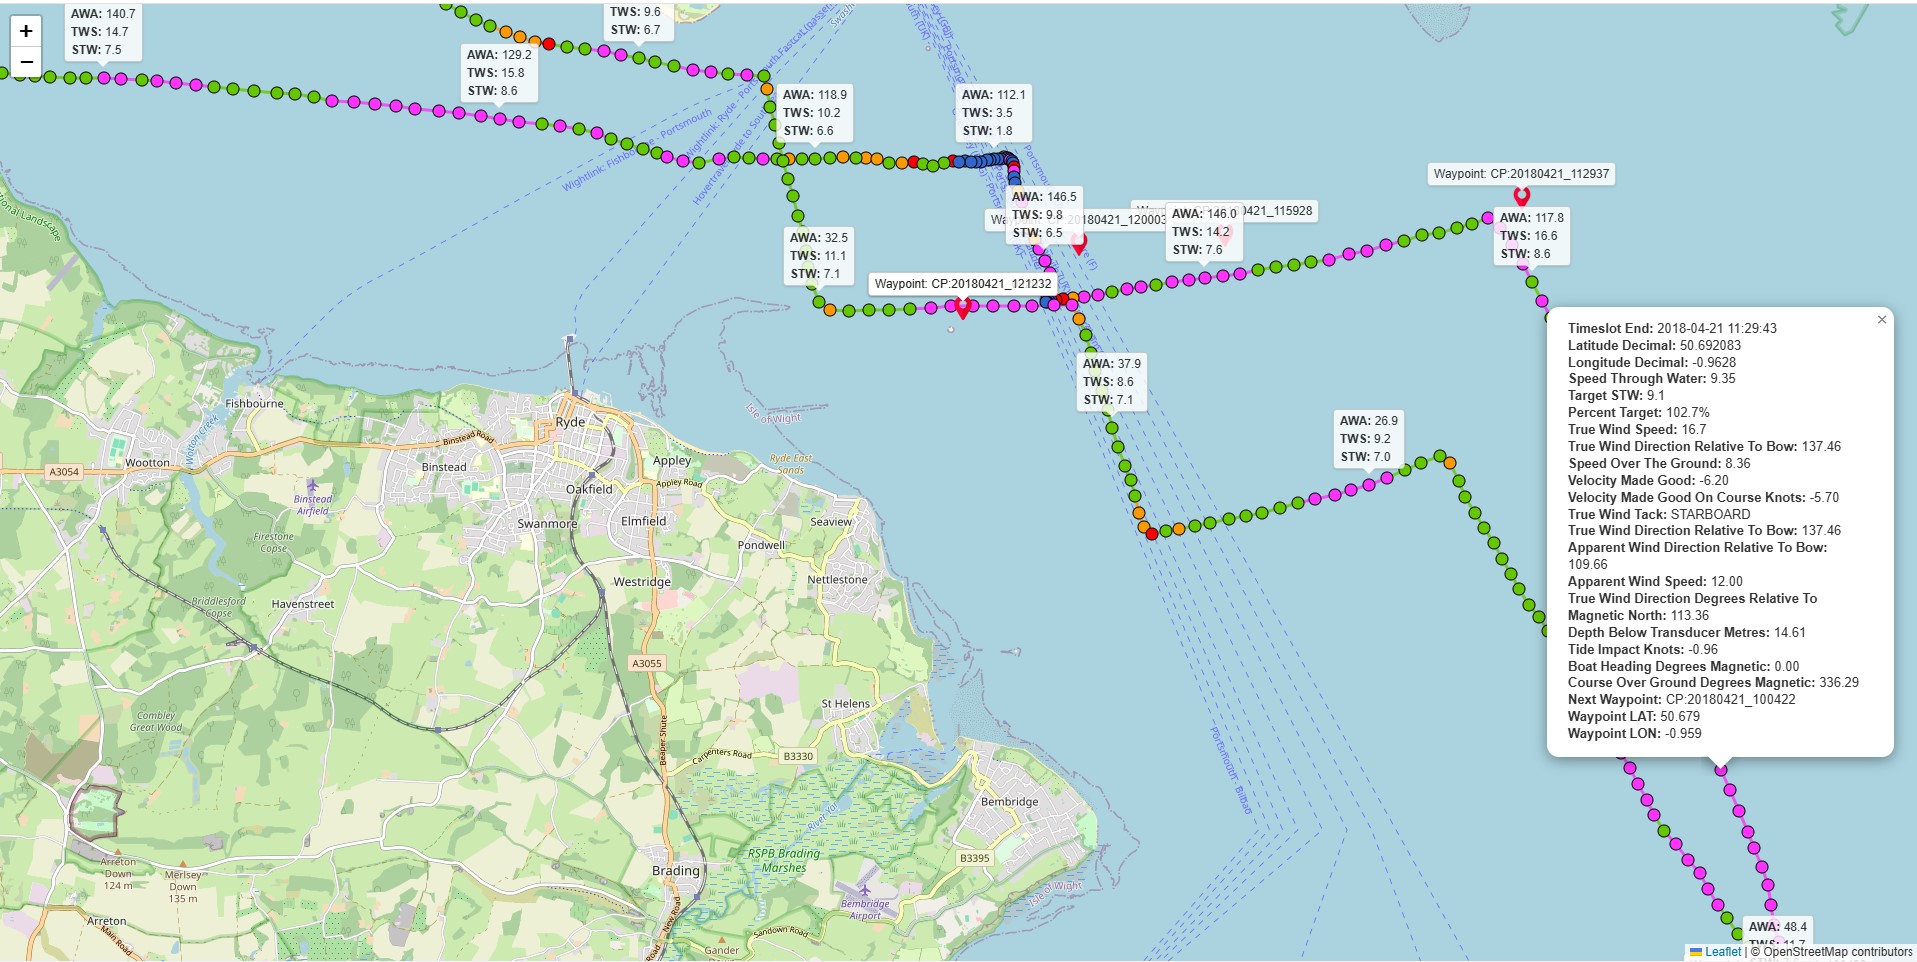
Track Map Panel
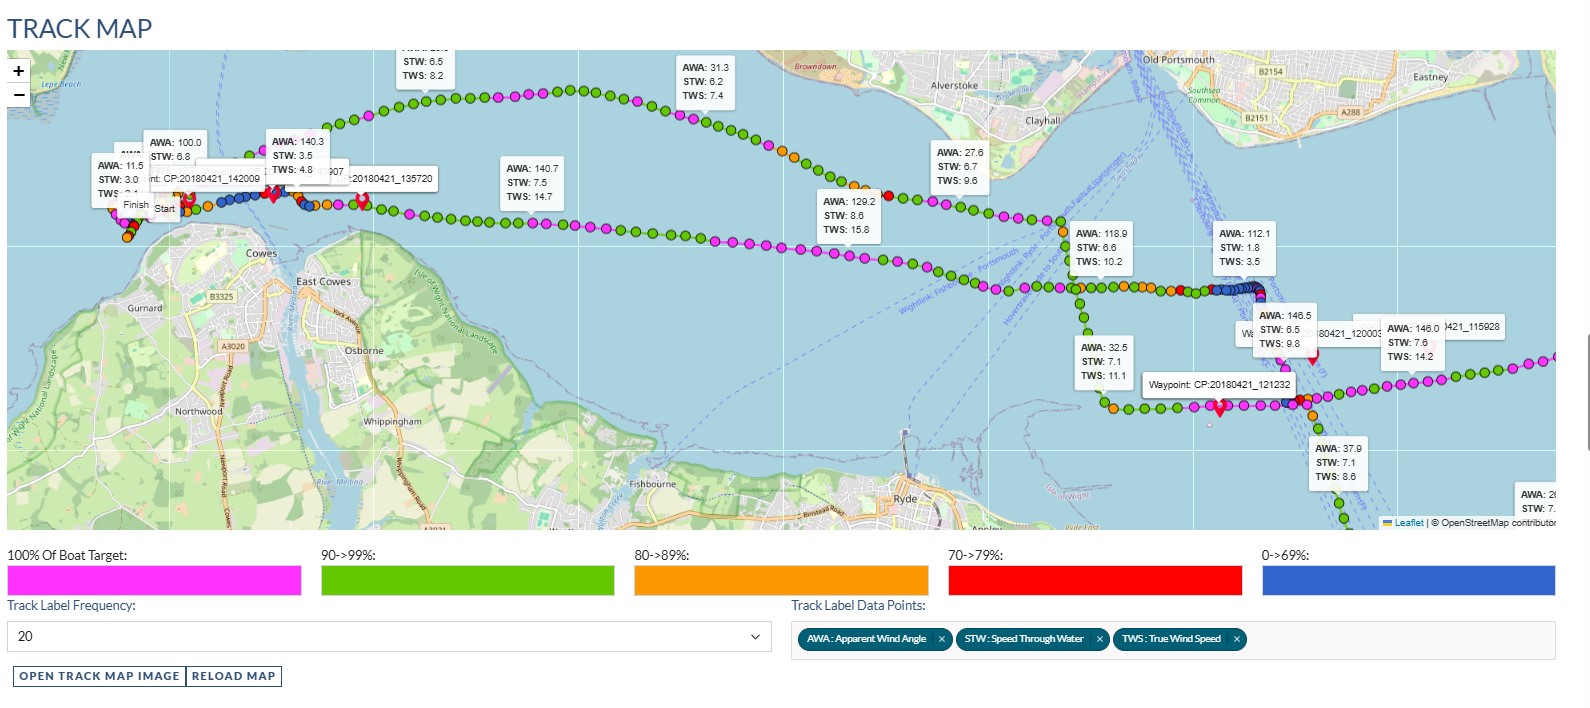
This panel behaves in a similar way to the Track Map panel on the Rockit Session Recording screen.
With this panel you can;
- See the track of the boat with a data point at the end of each timeslot.
- See the Waypoints in the boats route.
- Each point is coloured based on its percentage of the target performance level.
- You can then select the values to display on the labels (or no labels)
- You can also select how often the labels are displayed. Every 5/10/20/30 datapoints depending on how zoomed into the panel you want to go. Selecting 0 will turn the labels off.
- The Reload Map button will update the information displayed when you have changed the settings.
Clicking a data point with generate a popup that displays all the values for that data point.
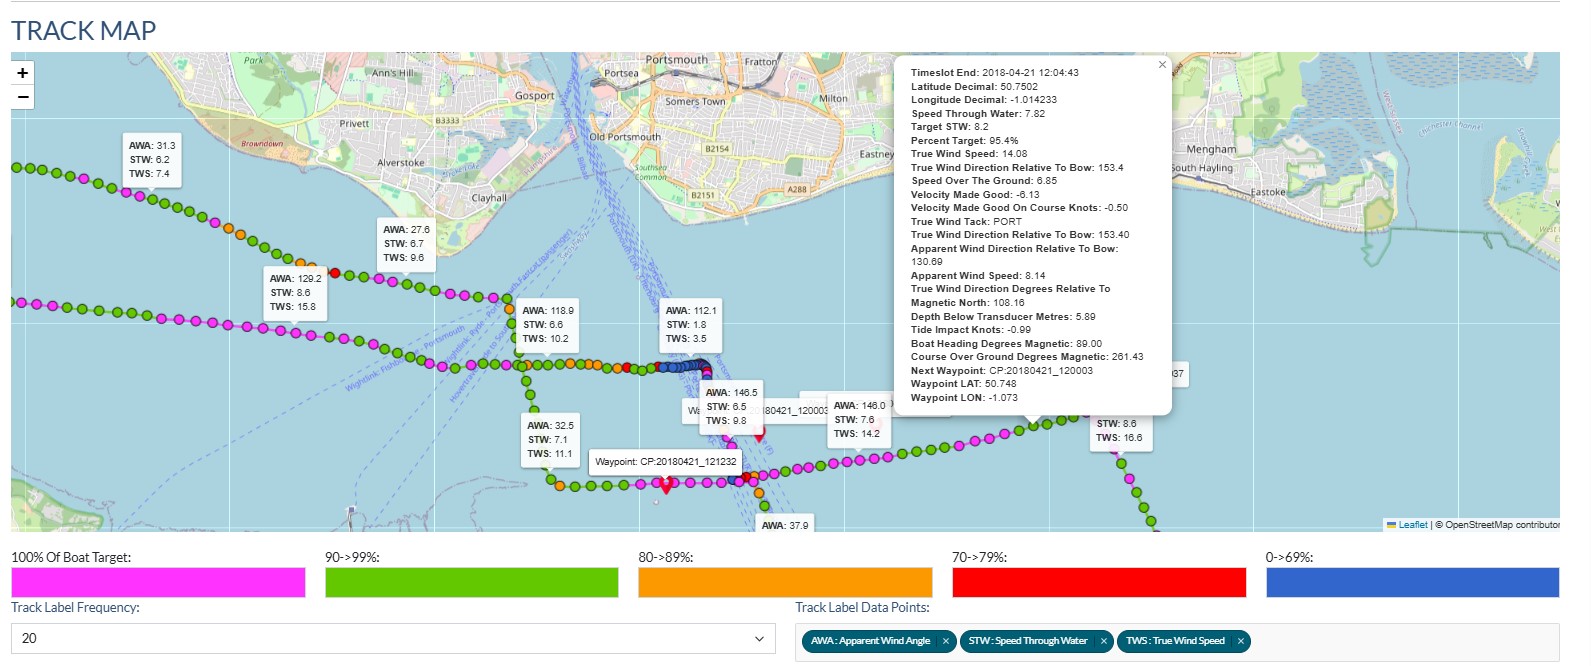
You can use the mouse or gestures on a tablet to Zoom/Scroll around the map.
Open Track Map Image will put the map panel into a separate browser tab effectively making the map a separate full screen map.
Section Four : Session Polar Data
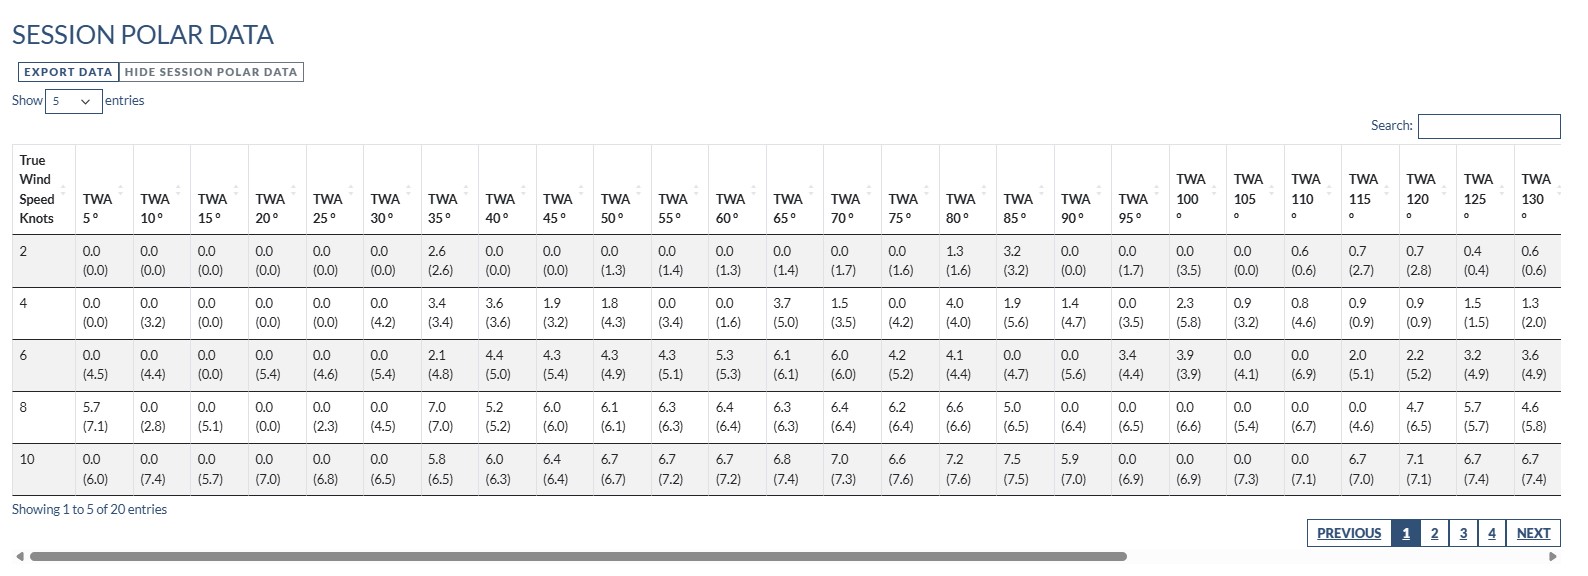
The Session Polar Data table/panel displays the polar values calculated for the session.
Polar value a based on the average for a timeslot. The value in each cell in the table represents the best average performance in the session for that given True Wind Speed and Angle. The number in brackets is the boats best performance for that True Wind Speed and True Wind Angle.
In the table above TWA 60 TWS 10 has the value 6.7 (6.7) this mean this sessions value is the best performance for that TWS/TWA for the boat. Unlike TWA 35 TWS 6 which has 2.1 (4.8); the boats best performance, and therefore the target value for the percentage performance is 4.8 knots in this session the best the boat managed was 2.1knots.
0 values; 0.0 (0.0) imply the boat has never sailed at that TWS/TWA combination. 0 (6.7); implies the boat has not sailed at that TWS/TWA combination during this recording session.
The graphs in this section are generated from the data in this table.
Computed Session Polar Data Graph
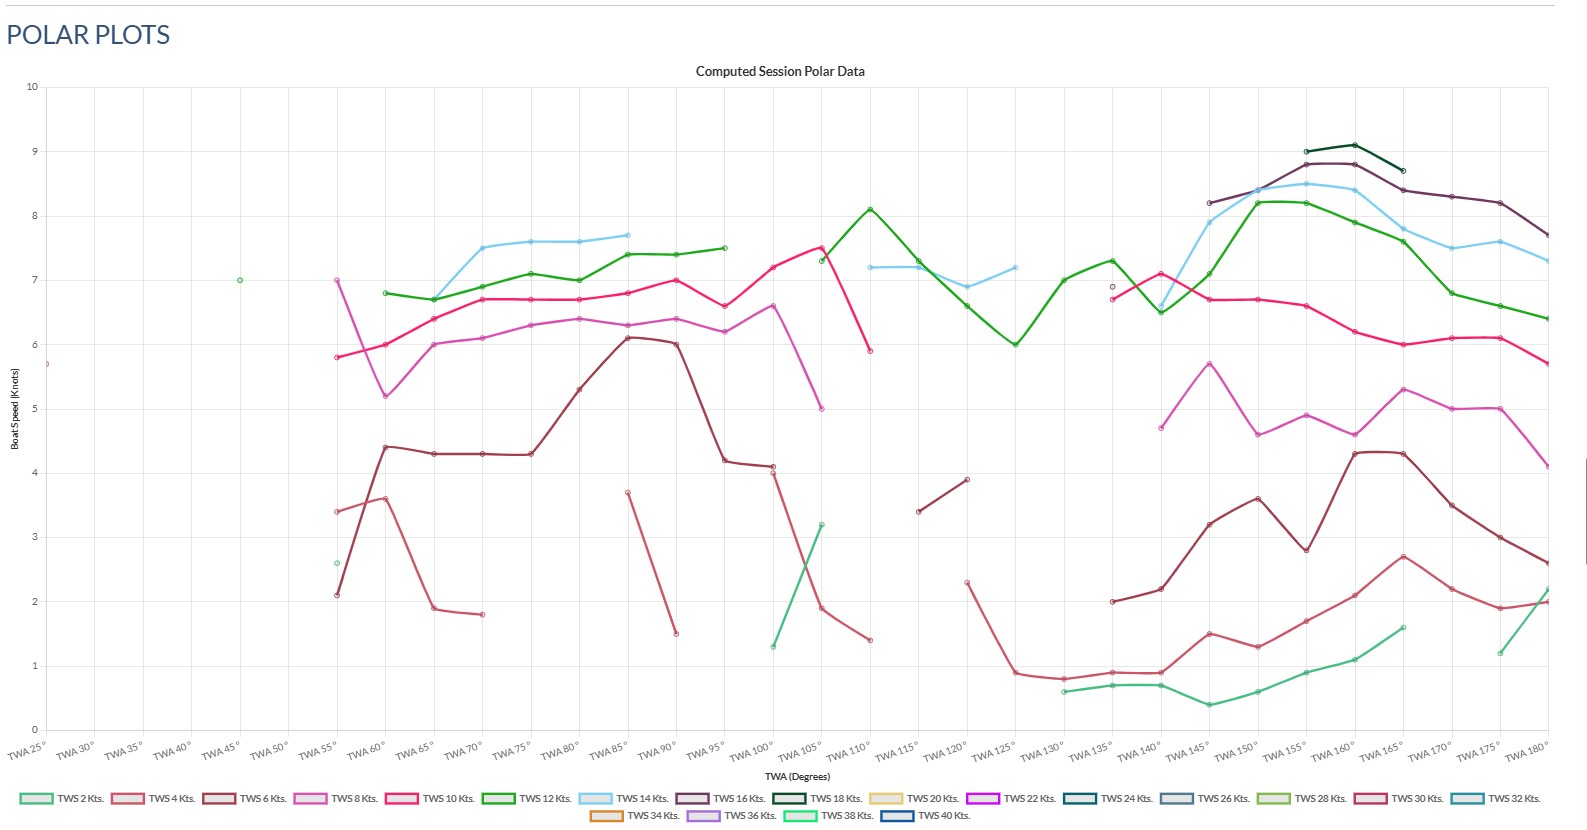
This graph plots the values from the table for a Session onto a standard line chart. The functionality is identical to the line charts; you can turn series on or off and zoom in or out. The graphs only plot the populated values. So if there is a TWS/TWA combination that is not present in the session nothing, including a zero value, will be displayed.
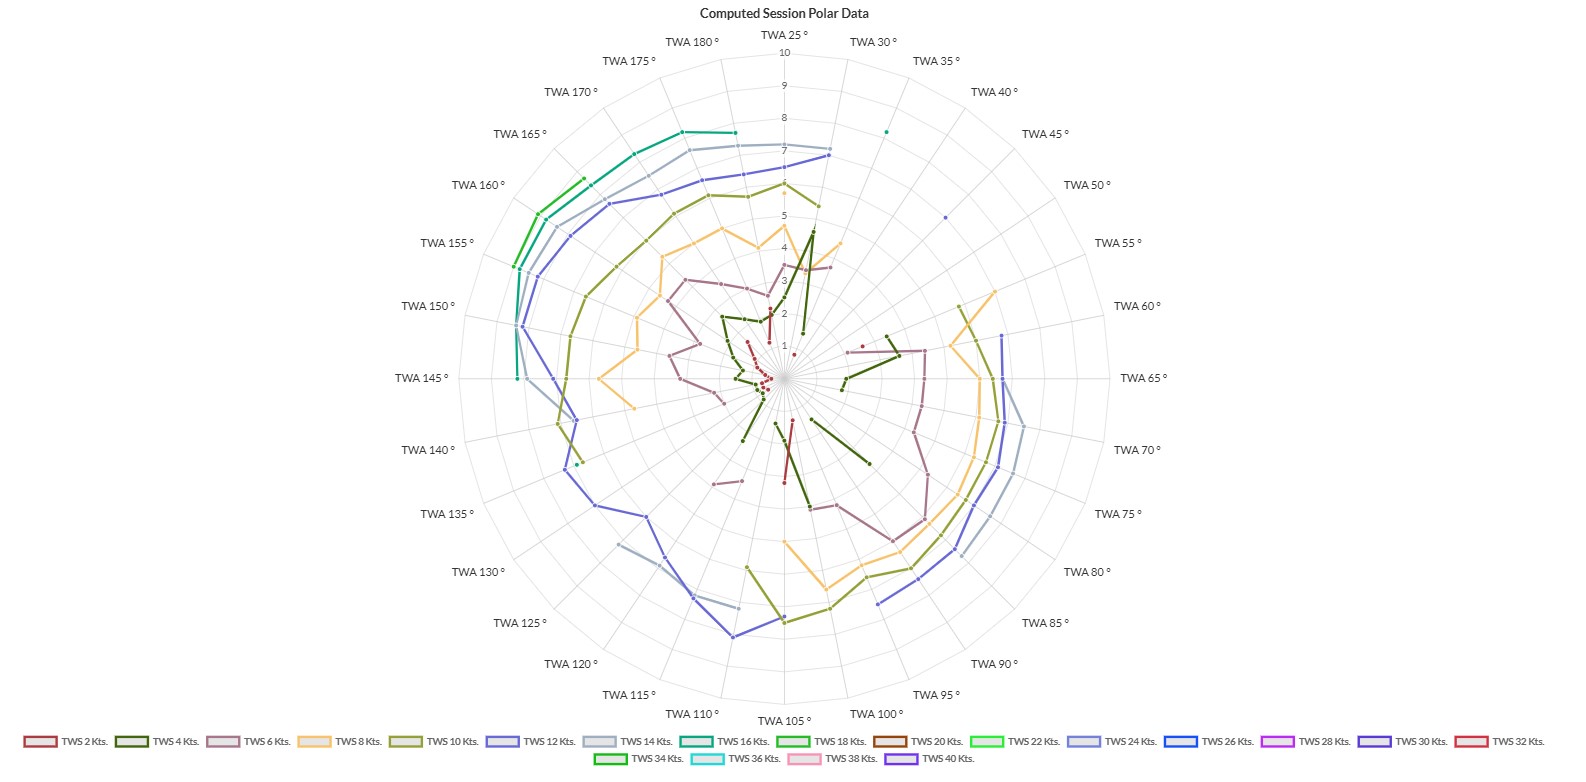
Session Polar Radar Chart
The Session Polar Radar chart displays the same information in the more conventional Radar chart format.
Section Five : Sail Configuration
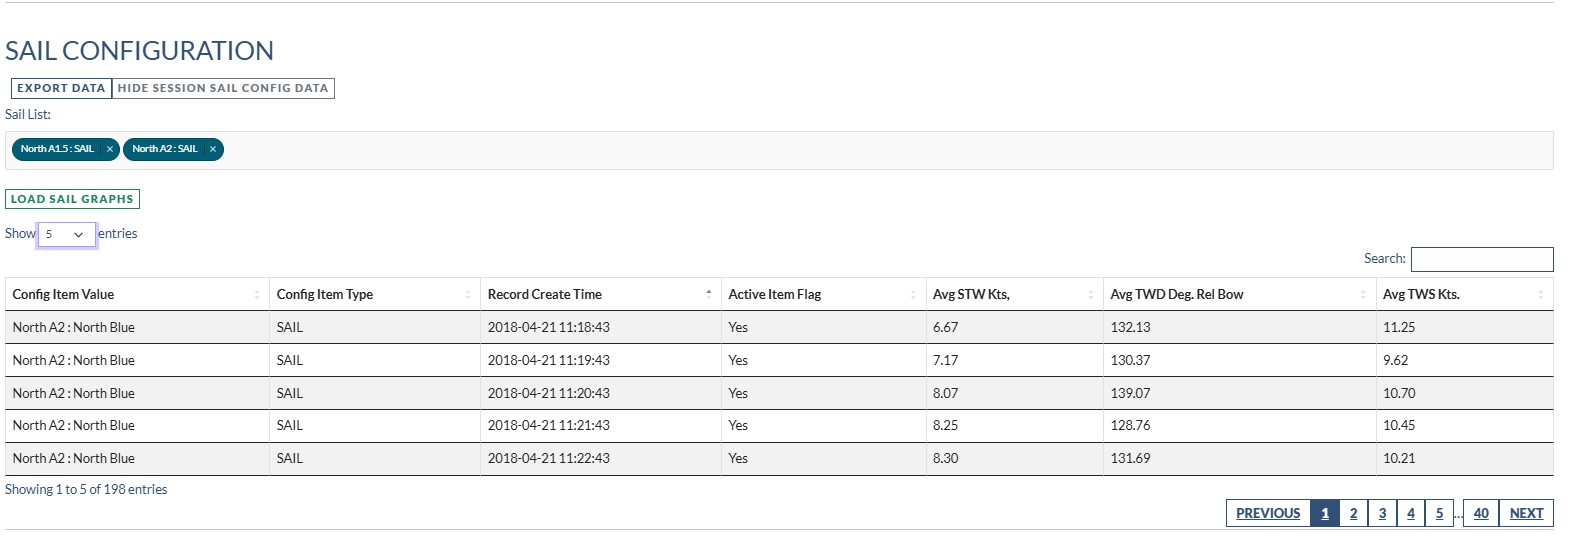
The sail configuration table takes the Time Boat Configuration information uploaded from the Rockit Software and plots it on a series of scatter charts. Which sails are active in which timeslot can be managed through the Rockit software. Follow the instructions below to find out how to manage that information.
Editing Time Boat Configuration Records
To display the performance for a set of sails;
- Pick the sails you are interested in from the Sail List.
- Click the Load Sails Graphs button.
That will pull the data into the table and draw the matching graphs. If the sails aren’t active during a session no data will be displayed. The table displays the Speed Through the Water (STW), True Wind Direction Relative To Bow (TWA) and True Wind Speed in knots(TWS) values for each timeslot where the sail is active.
This is pulling configuration items with a CONFIG_ITEM_TYPE value equal to SAIL only from the Rockit Analytics Platform database.
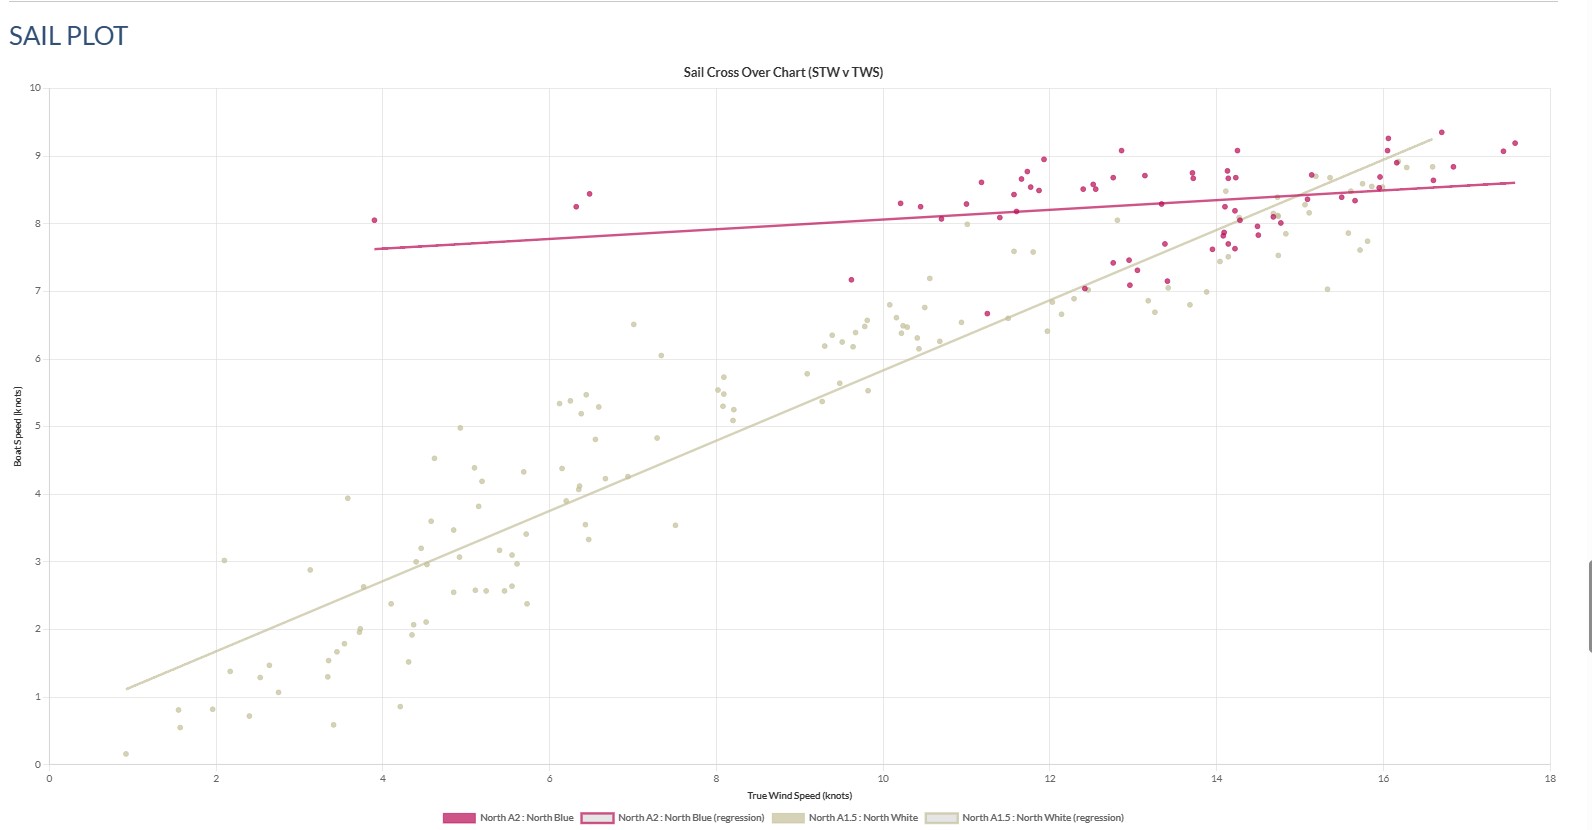
There are then 3 graphs to display the information.
Sail Cross Over Chart (STW v TWS)
Plots each sail as a series with the STW and TWS on the axis. The data points for each series are plotted as a rough cloud of points and a linear regression line plotted.
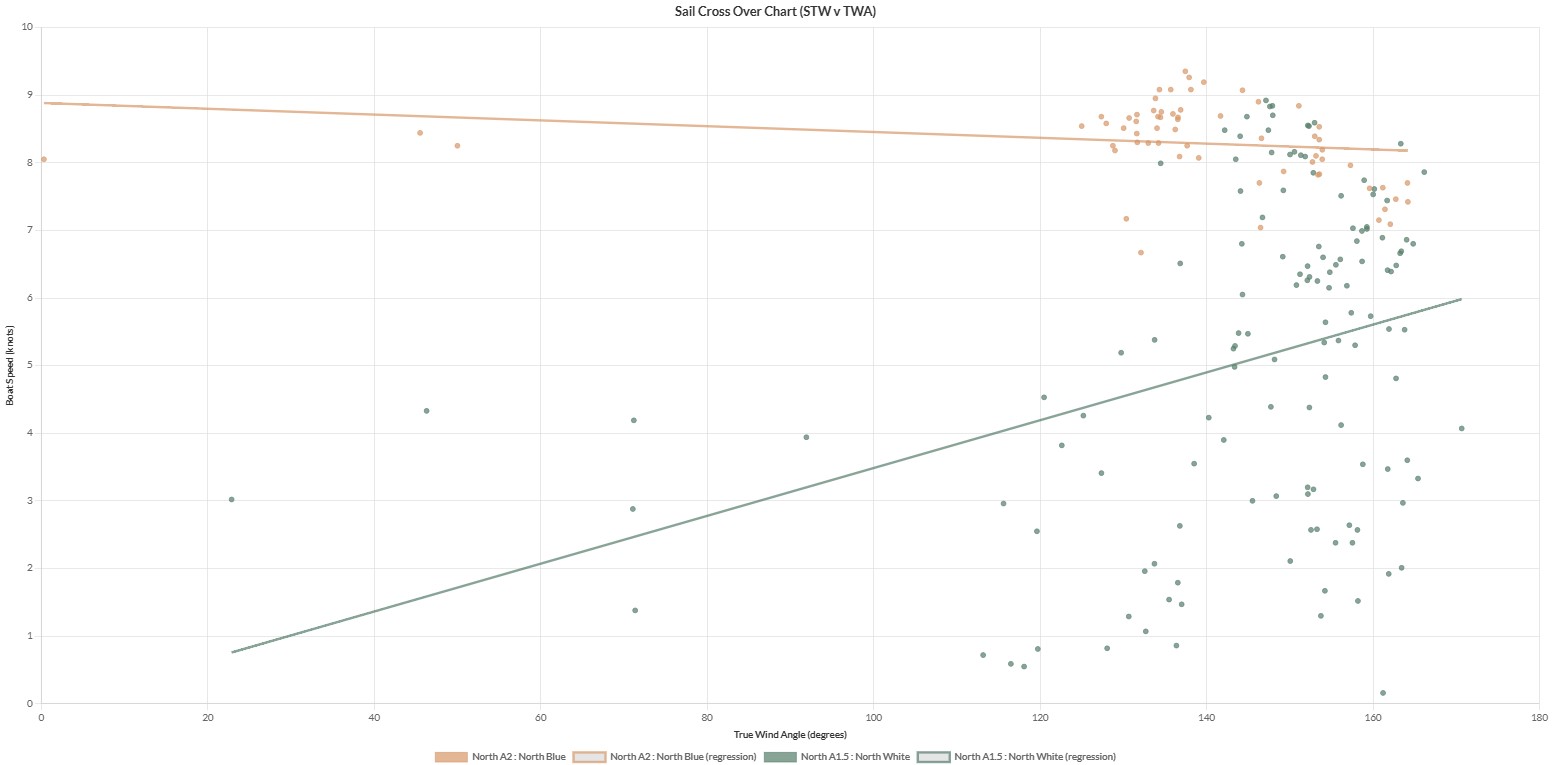
Sail Cross Over Chart (STW v TWA)
Plots each sail as a series with the STW and TWA on the axis. As with the STW V TWS plot there is a linear regression line and the data points are plotted as a cloud.
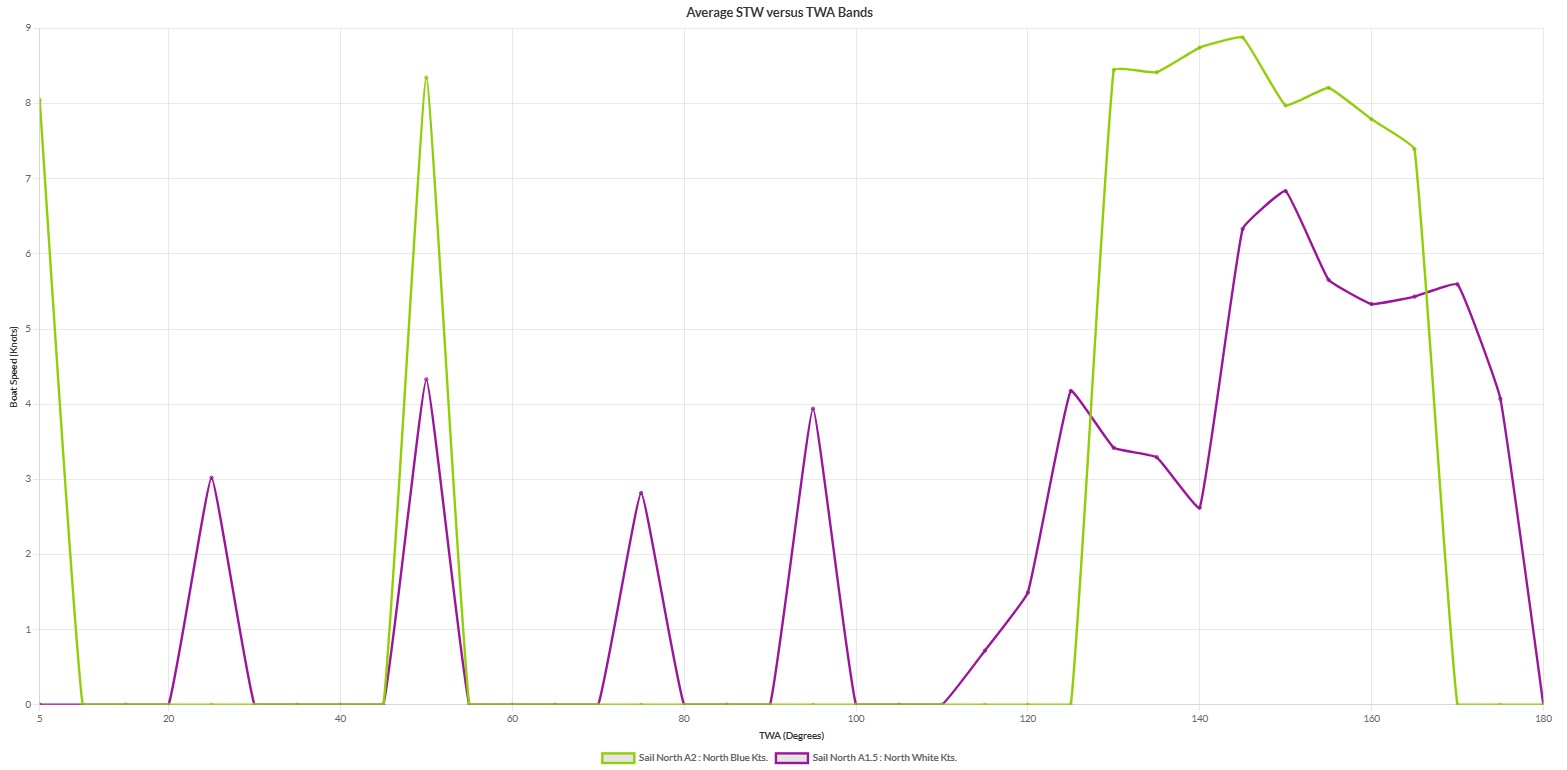
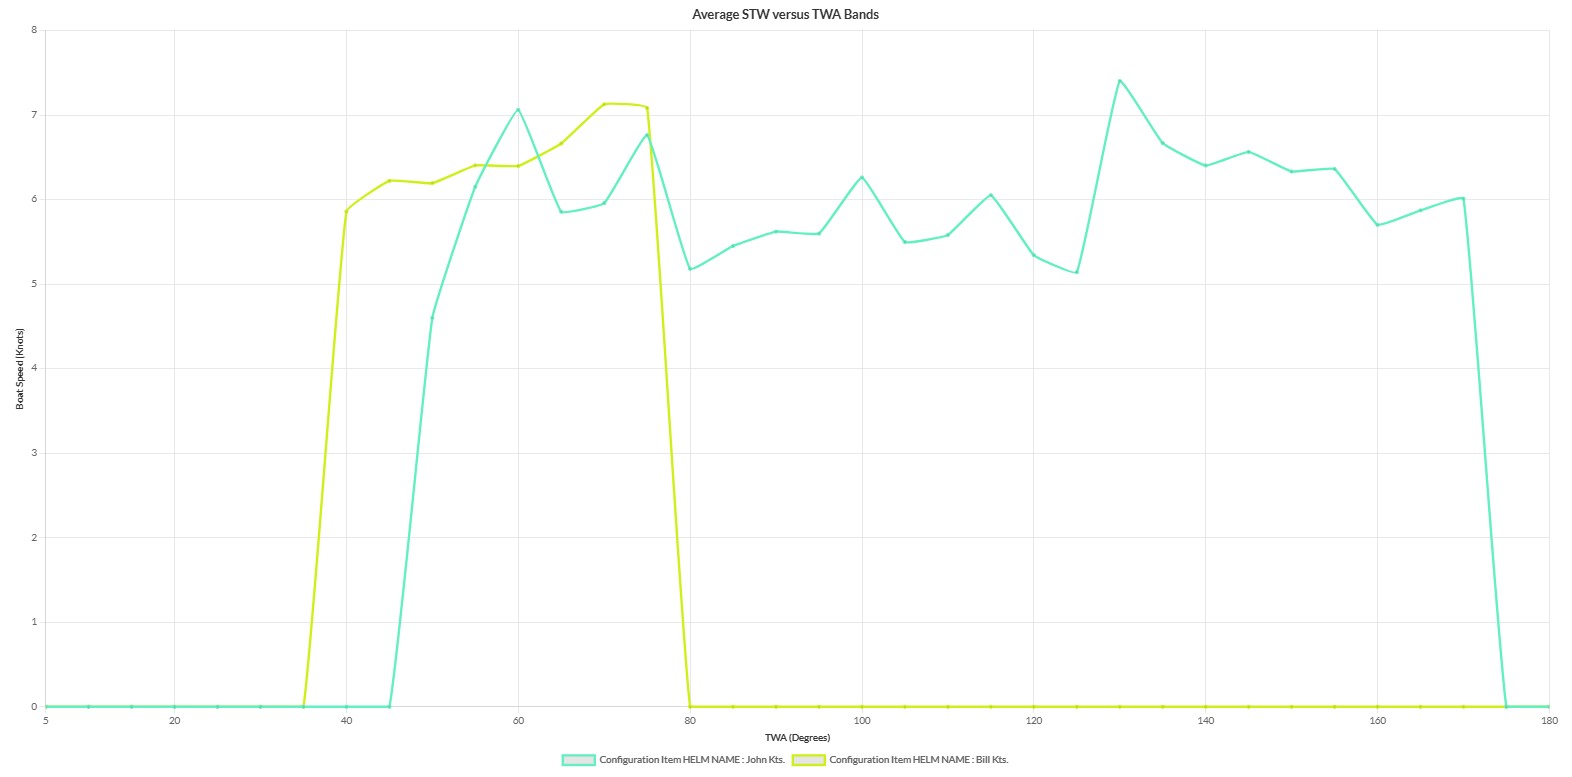
Average Speed Through Water Plotted Against True Wind Angle Band
Plots each sail as a series; it divides the TWS data points by TWA band (as with the Polar Data) and plots the data.
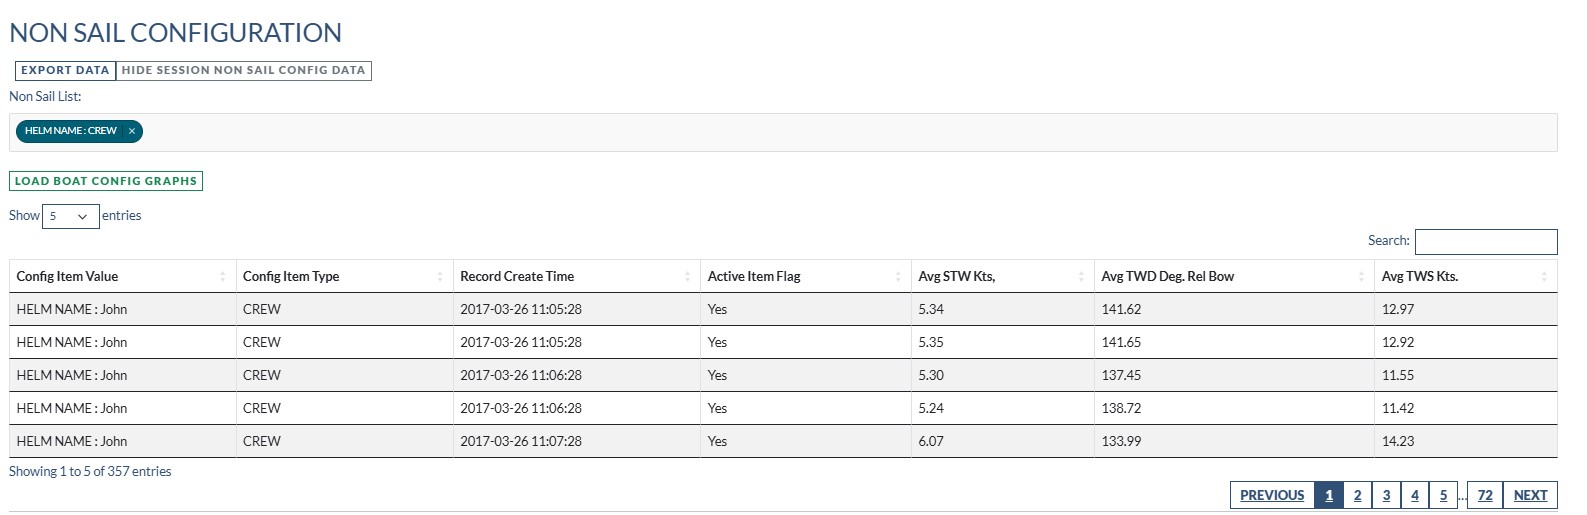
Section Six : Non Sail Configuration
Non Sail configuration works the same way as the Sail Configuration. You pick the item from the Non Sail List and click the Load Boat Config Graphs to pull the data into the screens and populate graphs. This will pull any data point from the Rockit Analytics Platform database that doesn’t have a CONFIG_ITEM_TYPE equal to SAIL.
There is one subtle distinction with the way that these Configuration items are used. There are two ways to use the Boat Configuration screens in Rockit to generate useful information.
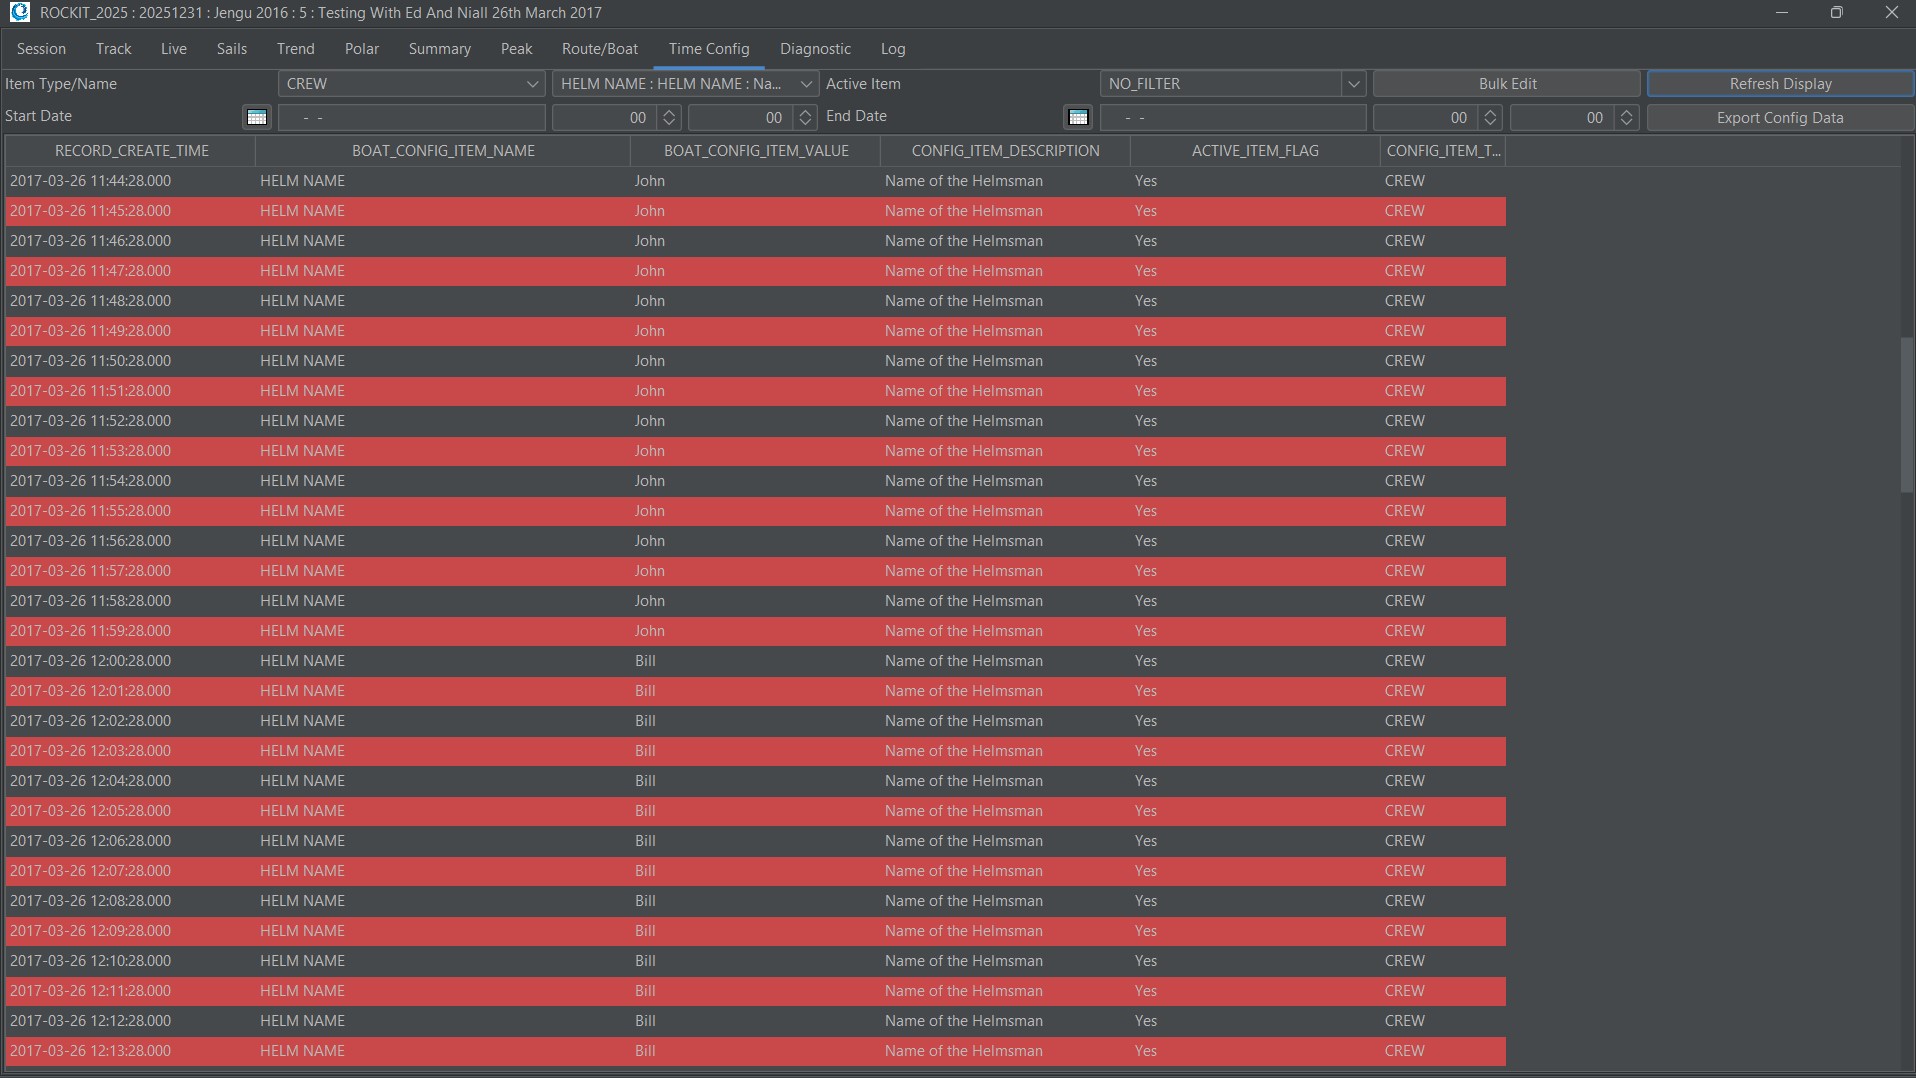
- The easiest option is to create a single Boat configuration Item and change the value as it changes on the boat. So you could have an item such Helm Name in the Rockit Software and update the value field to match whoever is Helming the boat in a specific Time Slot. That you can do through the Bulk Edit screen as discussed in the Sail Configuration section above.
- Alternatively you could create a series of Boat Configuration Items for different helms. HELM_NAME_BILL, HELM_NAME_JOHN and so on; you make that item active when they are helming. You can still edit that status within the Bulk Edit Screen in the Rockit software.
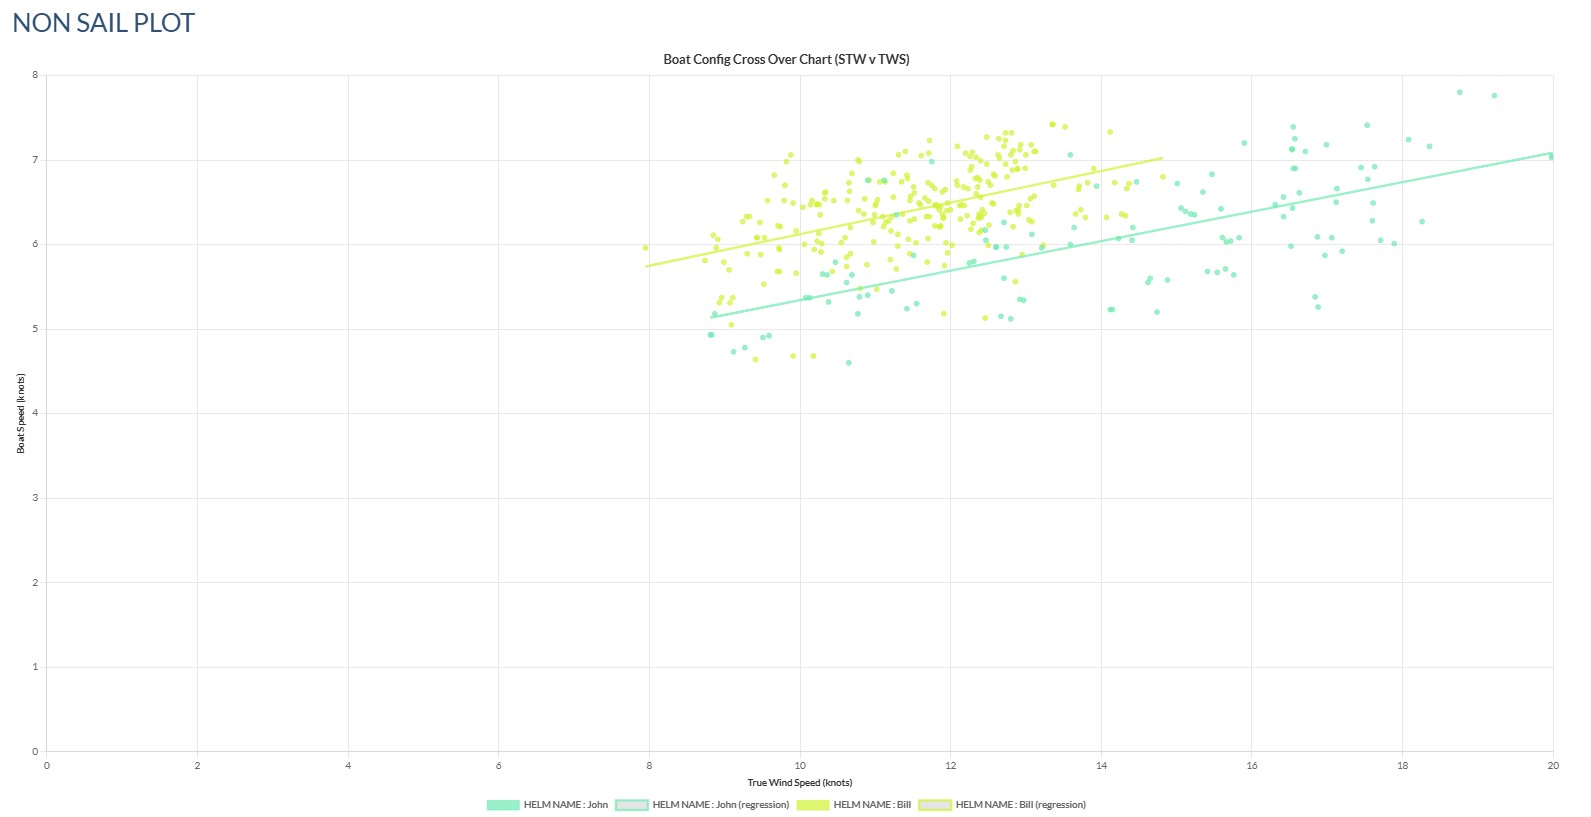
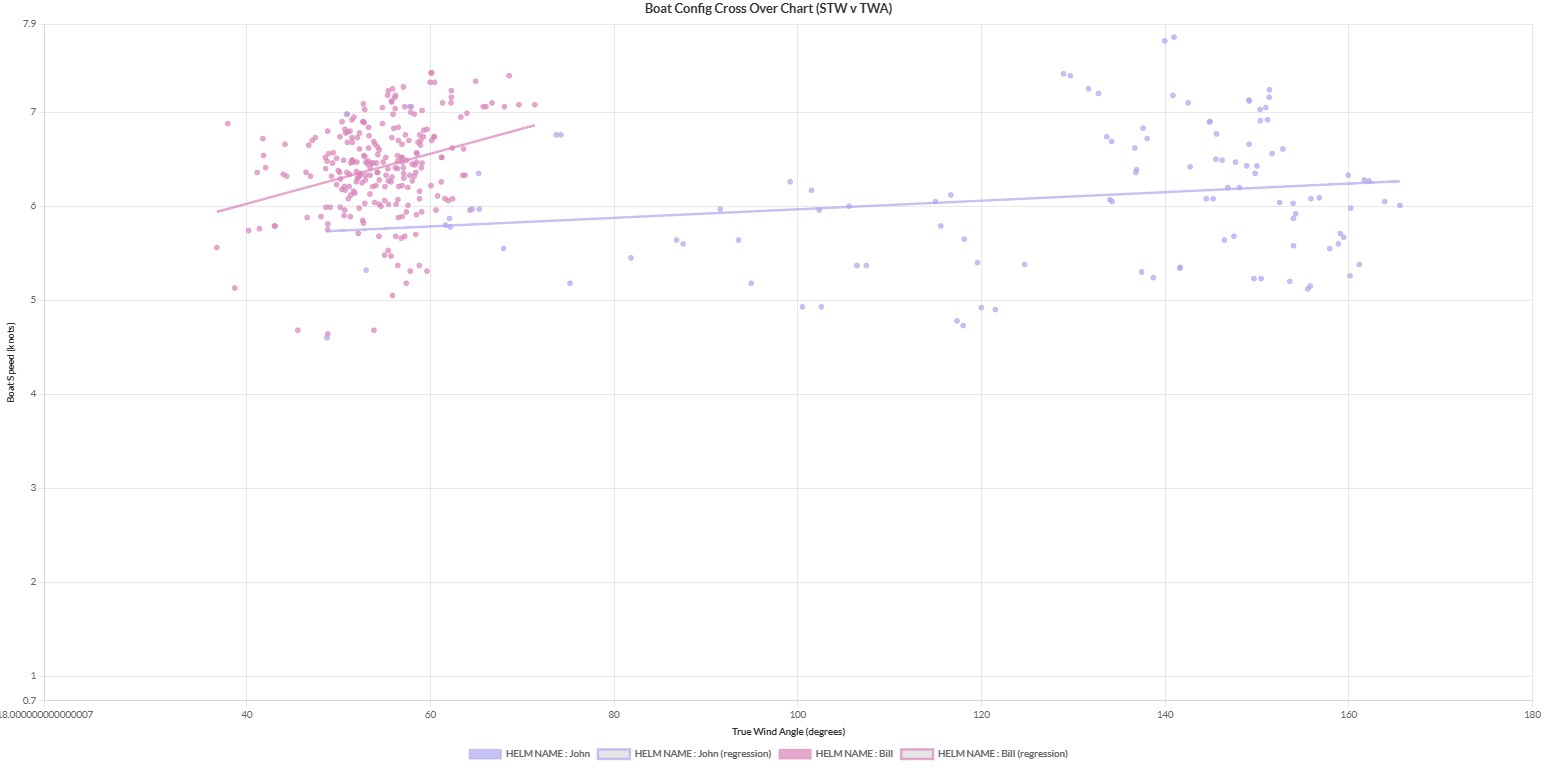
Non Sail Configuration Graphs
These graphs are the same format as the Sail Graphs.
Speed Through The Water versus True Wind Speed
Speed Through The Water versus True Wind Angle
Average Speed Through The Water versus True Wind Angle Band.
Seven : Creating A New Blank Session and Importing Data From CSV
When we originally created the Rockit Analytics Platform we assumed that the data would come from either a Rockit Server device or Rockit Software running on a Windows computer. Having talked this through with our sailing colleagues we realised there was the opportunity to bring data into the platform from other sources via an import file approach. So added a New Session function on the Recording Session Edit panel.
You can then import Performance Summary data into the Session Performance data section. Combine that with polars imported into the VPP Polar section of the Boat page and you have the ability to assess a boats performance. You have basic performance information to combine with the performance targets for the boat so the graph and map functionality in Section two above will all work.
Follow these steps to create a new session
- Click the New Session button.
- Click the Select Boat button to select a Boat for this session. Click on the row to Select the Boat.

- Timeslot Size is irrelevant as your source data will not be recalculated so this field is read only.
- Add a Description
- Add some Notes
- Press the Save button
This will create a Session with no data other than the Session record. You can now import data into the Session on the Session Performance Data panel.
- Select the Recording Session again from the Session list.
- Click the Show Recording Session Performance Data to expand the panel with the performance data table.
- Use the Choose File dialog to select the file to load. The file format is import. If you want a template for the file the best option is to export an existing data Recording Session to csv using the Export Data button on the Session Performance Data panel.
- Click the Read Summary Data File. That will import contents of the csv file into the table in the page for you to review.
- If you are happy with the way the data looks click Upload Summary Data File to load the data into the Rockit Analytics Platform database.
There are a couple of interesting features with this.
Because of the way that the Rockit Analytics Platform screens work the graphs and track map panel will be populated for the Performance Summary data even though the actual data hasn’t been saved to the database. The graphs and map read their data from the table on the screen as that more efficient in terms of network traffic that pulling the data back for each graph from the server. We try to read the data once and use it many times.
You can only upload a Time Performance record once. The Timeslot Start and End dates are effectively part of the unique key for each record so attempt to upload the file a second time will fail.
A Note On Date Formats, Latitude and Longitude.
Date Formats and Lat and Long formats in the file are critical. Make sure any csv file has formats that match those below.
Dates : YYY-mm-dd hh:mi:ss => 2025-12-31 23:56:56; Dates in Rockit are stored at UTC time zone rather than local time; otherwise issues with trips through multiple time zones become very complex.
Latitude and Longitude: Held in two formats decimal and string. Latitude and Longitude are help in separate fields.
- Latitude Degrees Minutes and Second => 50° 48′ 28.86 N => Latitude Decimal : 50.808017. Southern and Eastern hemisphere decimal values are negative
- Longitude Degrees Minutes and Second => 001° 15′ 49.78 W => Latitude Decimal : -1.262878. Southern and Western hemisphere decimal values are negative
The string values are present for clarity. All calculations in Rockit are performed on the Decimal values.