Understanding how fast your boat should actually go is key to making sure you get the most out of it.
If you’ve ever wondered why speed over ground (SOG) isn’t the best guide to fast sailing or why some trips just feel sluggish despite good wind, then dive into polars and VPPs—tools that translate wind and yacht data into performance targets and insights.
What Are Yacht Polars and VPPs
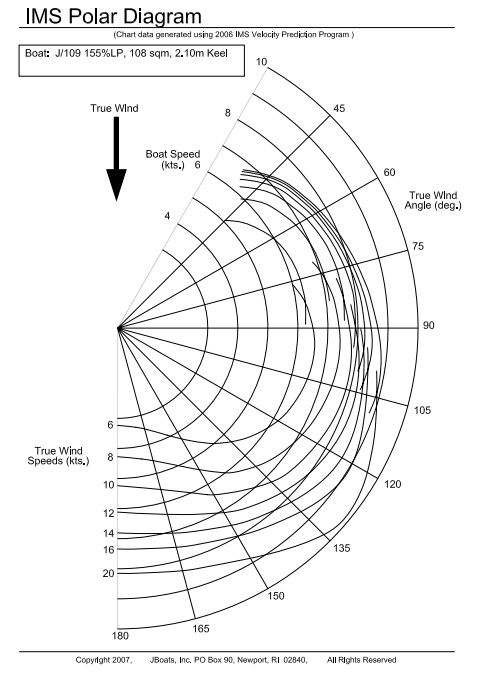
Polar diagrams, or simply polars, are plotted curves showing how fast your boat should sail under various wind speeds (TWS) and wind angles (TWA). You read them like a weather map for performance—pick your TWS and angle to get a theoretical boat speed.
VPP, The data behind these curves comes from a Velocity Prediction Program (VPP): software that calculates performance by balancing sail and hull forces, hull resistance, heel moment, righting moment—essentially running hydrodynamic and aerodynamic simulations to tell you what speed your yacht should hit for a given wind speed and angle.
How Rockit Uses Polars In Practice
On Ashtree Marine’s Rockit system, the theory meets reality:
- Seed data is imported from a VPP (for instance Sailfish). That becomes your initial polar table.
- Session data is collected onboard and compared against those predictions—this real‑world info often surpasses the VPP, especially when your crew is sailing well. Once performance exceeds VPP, Rockit uses the real data as the polar target.
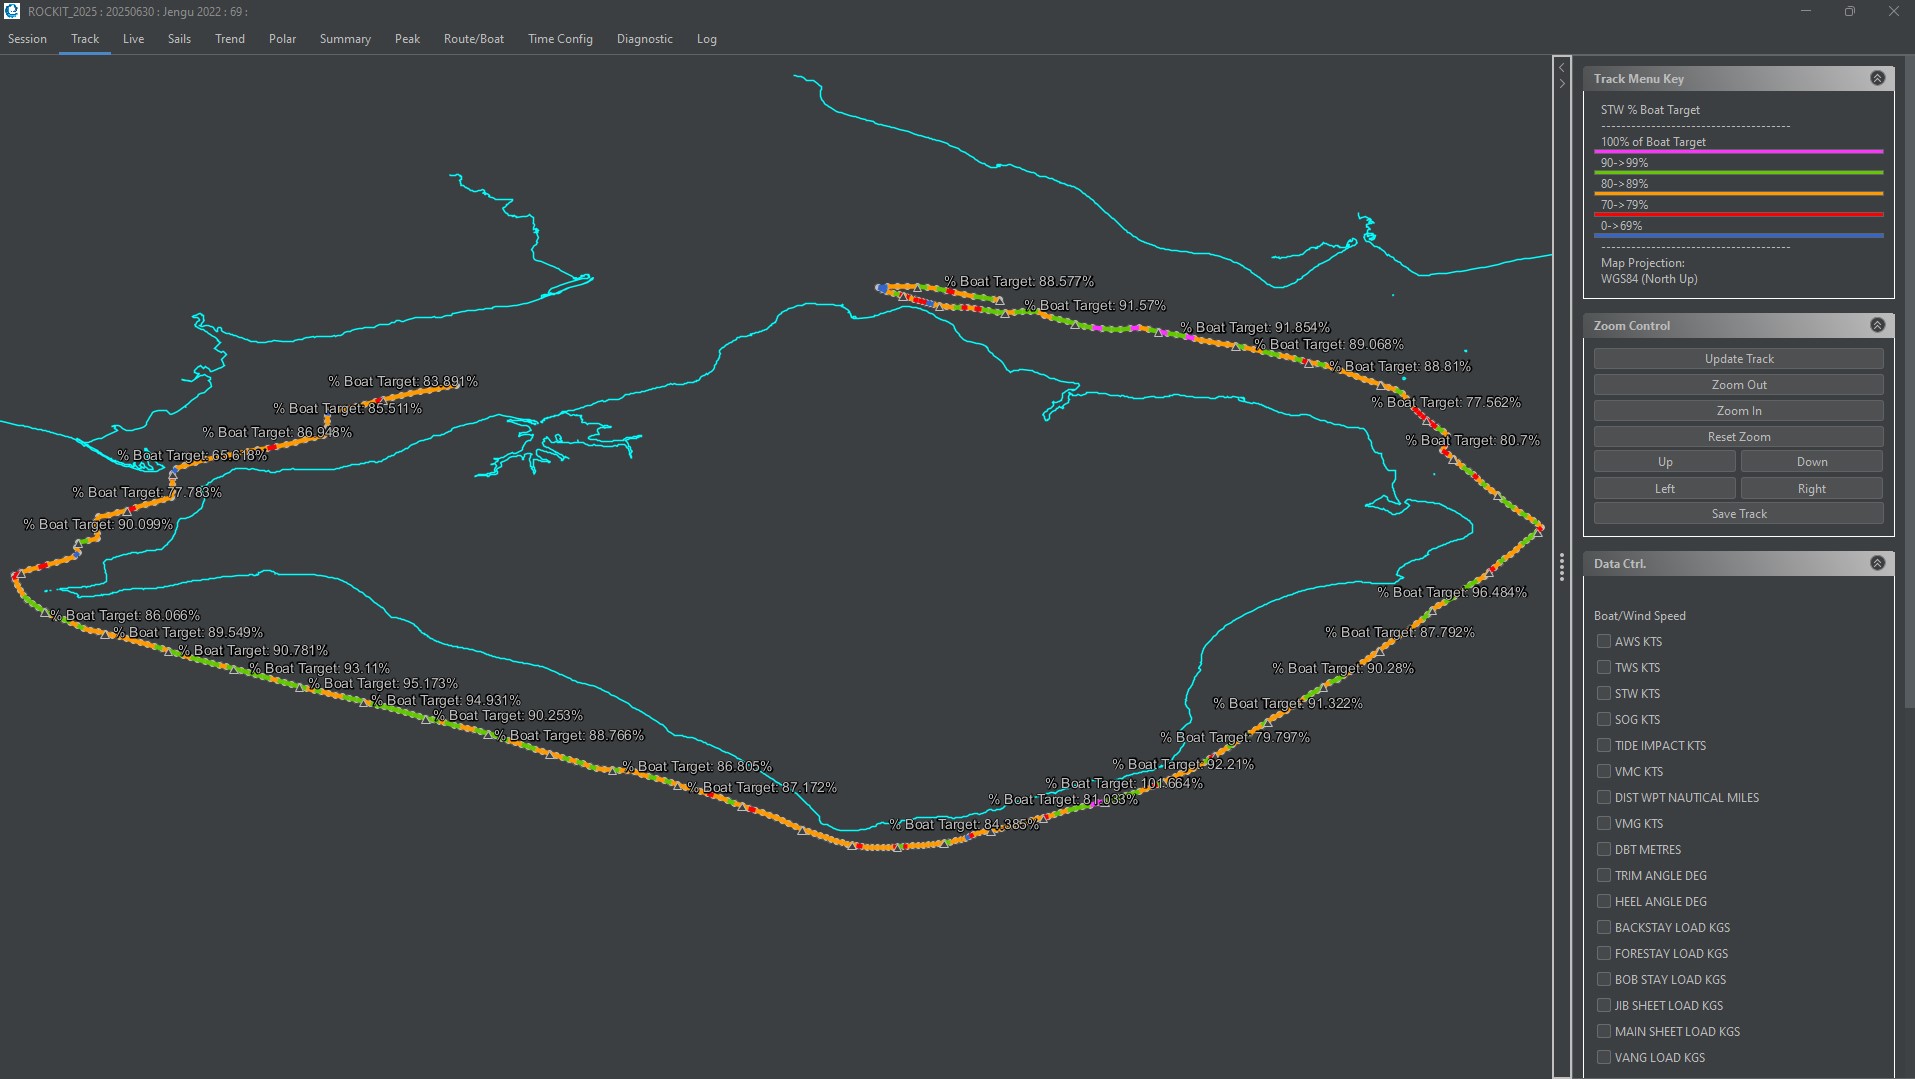
- Visual feedback: Your tracks are colour coded—pink shows you’re at or above performance target (“fast”), blue means more work to do. It helps highlight performance lapses and brilliant legs alike.
Polars, VPPs and Boat Performance: Practical Applications
- Optimise sail choice and sail trim: At a given wind speed, a polar tells you whether you’d be faster bearing off with a genoa, switching to a reacher, or rolling in a reefed headsail.
- Measure performance, not location: By basing analysis on speed through water (STW) instead of SOG, Rockit removes tide and current—giving a true picture of how well you’re harnessing the wind.
- Progress tracking: With session polars aggregated across multiple sails, crew combinations and conditions, you can build a nuanced performance evolution chart.
Why It Matters: Real Insight vs Guesswork
- Theory vs Reality: Polars generated via VPP are often excellent benchmarks, but real conditions, crew skill, hull condition, and instrument calibration can cause divergence. Using session data allows you to fine‑tune polars for real‑world sailing.
- Crew Feedback in Real Time: Using Rockit’s live display gives consistency and clear feedback on helming and trim decisions, race by race, tack by tack. It becomes obvious where gains (or losses) happen.
- Better routing: Once you understand actual polars, this data becomes invaluable when plugged into routing tools (like PredictWind or Adrena)—you’ll get route suggestions tailored to your boat, not just theoretical models.
Bringing This to Ashtree Marine’s Audience
 At Ashtree Marine, we’ve taken these industry‑grade tools (VPP polars, session overlay, performance colour coding) and packaged them for boats of all levels using Rockit. Ashtree blog readers know that:
- We translate complex data into accessible visuals and tables.
- We encourage instrument calibration, because skewed angle or wind speed data can distort your polars
- We show how to import sailfish‑based polars, how to adapt them with real‑world sailing, and how to export them for routing modules
Want to Get Started?
- Get your yacht’s VPP polar table (e.g. from Sailfish or ORC certificate data)—this becomes your baseline.
- Use Rockit onboard to record TWS, TWA, STW sessions, and overlay performance with VPP curves.
- Review session polars, refine your targets, and apply them to navigation and trim.
- Export refined polars to routing software to generate the most efficient passage plans.
In Summary
- Polars map theoretical speed to wind conditions via VPPs.
- Rockit from Ashtree Marine helps you compare theory to reality—session by session.
The goal? Consistent, measurable performance, smarter sail choices, and passage routing tuned to your boat.
If you’d like a walkthrough of preparing, importing or refining your polar data, or tuning your dashboard for live feedback, just let us know.
Let’s set sail—and make every knot count.
Want to read some more ?
Try these blog aritcles;